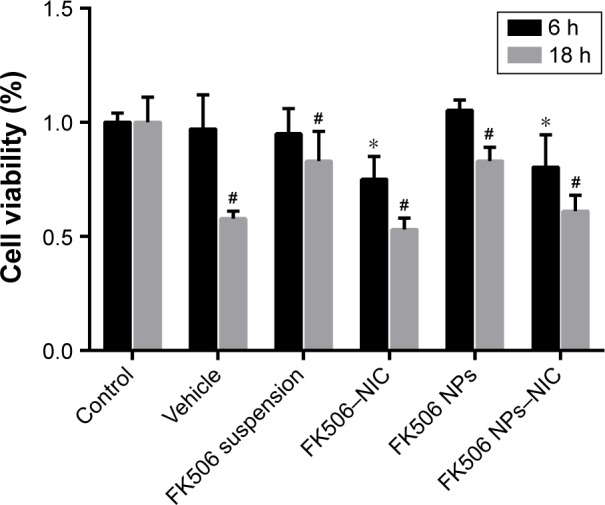
Figure 7.

Antiproliferation effects of different formulations on HaCaT cells.
Notes: Each symbol and bar represent the mean ± SD of three determinations. Significant differences were calculated using the ANOVA test (*P<0.05, compared to 6 h control and #P<0.05 compared to 18 h control). The concentration of FK506 in each formulation was 1 mg/mL.
Abbreviations: ANOVA, analysis of variance; FK506, tacrolimus; SD, standard deviation; NIC, nicotinamide; NPs, nanoparticles.
