Figure 6.
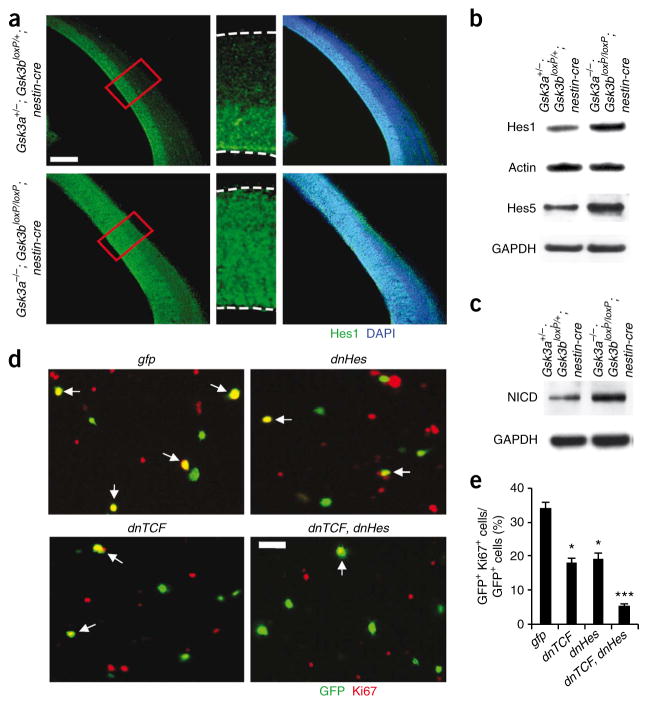
Changes in Notch signaling components and contributions of β-catenin and Notch signaling to GSK-3 deletion effects. (a) Expanded zone of Hes1 expression in Gsk3a−/−; Gsk3bloxP/loxP; nestin-cre brains. Left, in control brain sections at E14, Hes1 was mostly expressed in the ventricular and subventricular zone, where progenitors are normally located. However, Hes1 was distributed throughout the developing cortical wall in Gsk3a−/−; Gsk3bloxP/loxP; nestin-cre cerebral cortex. Middle, higher magnification of small boxes (red) from the left panels. Right, Hes1-stained fields were merged with DAPI-stained images. Scale bar represents 150 μm. (b) Western blotting showed that the level of Hes1 and Hes5 were significantly increased in the Gsk3a−/−; Gsk3bloxP/loxP; nestin-cre brain lysates. (c) The level of NICD was markedly increased in Gsk3a−/−; Gsk3bloxP/loxP; nestin-cre brain lysates. (d) Inhibition of either β-catenin signaling or Notch signaling partially blocked proliferation of Gsk3a−/−; Gsk3bloxP/loxP; nestin-cre cortical progenitors in culture. GSK-3 mutant cells were transfected with dnTCF, dnHes or control gfp. Cells were then cultured for 48 h and immunostained with antibody to Ki67. Overexpressing both dnTCF and dnHes suppressed proliferation of GSK-3 mutant progenitors to a higher degree than overexpression of either dnTCF or dnHes alone. Scale bar represents 25 μm. Arrows indicate transfected cells that were also positive for Ki67. (e) The percentages of Ki67- and GFP-positive cells relative to total transfected cells (GFP positive) were counted for quantification. * P < 0.01 (versus GFP), ** P < 0.01 (versus dnTCF or dnHes).

