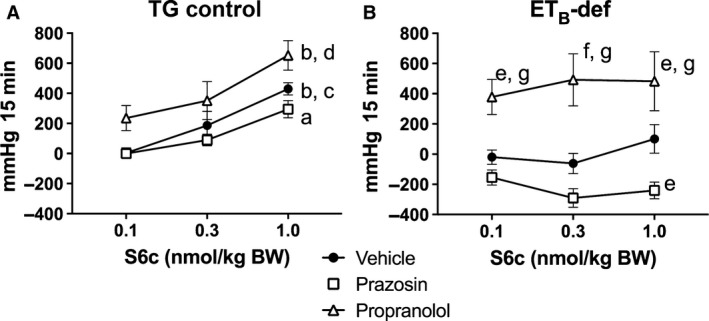
Figure 3.

Quantification of changes to mean arterial pressure following S6c in TG control (A) and ETB‐def (B) rats expressed as area under the curve. aP < 0.01, bP < 0.001 versus 0.1 nmol/kg S6c; cP < 0.05, dP < 0.01 versus 0.3 nmol/kg S6c; eP < 0.05, fP < 0.001 versus vehicle; gP < 0.001 versus Prazosin; TG Vehicle n = 4; TG Prazosin n = 5; TG Propranolol n = 4; ETB‐def Vehicle n = 5; ETB‐def Prazosin n = 5; ETB‐def Propranolol n = 4; two‐way ANOVA. BW, body weight; S6c, sarafotoxin c; TG, transgenic; ETB‐def, endothelin type B‐deficient; ANOVA, analysis of variance.
