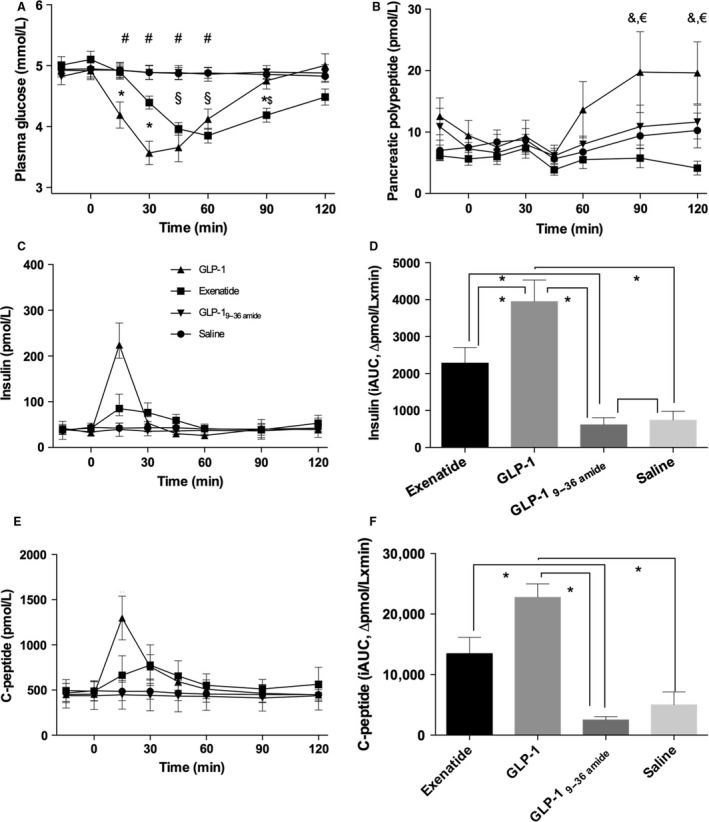
Figure 2.

Glucose, insulin, C‐peptide, and pancreatic polypeptide (PP). Symbol legends for the four experimental days; exenatide (squares), GLP‐1 (triangles), GLP‐19–36amide (inverted triangles), and saline (circles). (A) Plasma glucose: Days were compared by a two‐way ANOVA (infusion (P = 0.0001), time (P = 0.0001), and infusion × time (P = 0.0001)). Post hoc test (Tukey) yielded significant differences; exenatide versus saline/GLP‐1 9–36NH 2 ($), exenatide versus GLP‐17–36amide (*), GLP‐1 versus saline/GLP‐19–36amide (#). (B) Plasma PP: Days were compared by a two‐way ANOVA (infusion (P < 0.0001), time (P = 0.012), infusion × time (P = 0.56)). Post hoc test (Tukey) yielded significant differences; exenatide versus GLP‐1 (&), GLP‐1 versus saline (€). (C) Time courses for serum insulin. (D) Incremental AUCs (iAUCs) for insulin: iAUCs were compared by a one‐way ANOVA (P = 0.006), post hoc test (Tukey) yielded significant differences denoted by asterisk (*). (E) Time courses for serum C‐peptide. (F) Incremental AUCs for C‐peptide: iAUCs were compared by a one‐way ANOVA (P = 0.0001), post hoc test (Tukey) yielded significant differences denoted by asterix (*). Data are means (SEM). Two‐sided P < 0.05 were considered significant.
