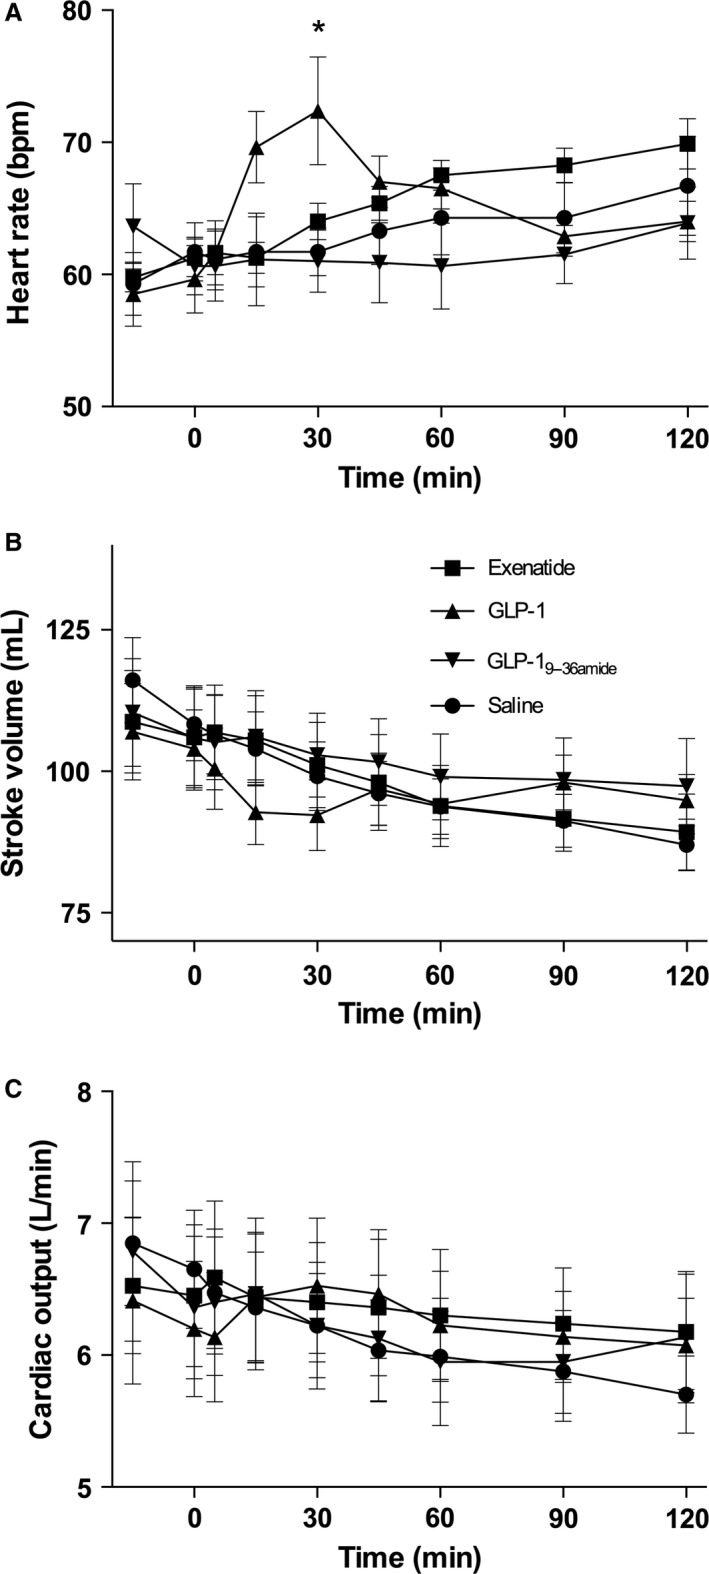
Figure 4.

Cardiac parameters. Symbol legends for the four experimental days; exenatide (squares), GLP‐1 (triangles), GLP‐19–36amide (inverted triangles), Saline (circles). (A) Heart rate: Days were compared by a two‐way ANOVA (injection (P = 0.0162), time (P = 0.0038), and injection × time (P = 0.082)). Post hoc testing (Tukey) yielded a significant difference, GLP‐1 versus saline & GLP‐19–36amide (*). (B) Stroke volume: Days were compared by a two‐way ANOVA (injection (P = 0.51), time (P = 0.0050), injection × time (P > 0.99)). (C) Cardiac output: Days were compared by a two‐way ANOVA (injection (P = 0.92), time (P = 0.66), and injection × time (P > 0.99)). Data are means (SEM). Two‐sided P < 0.05 were considered significant.
