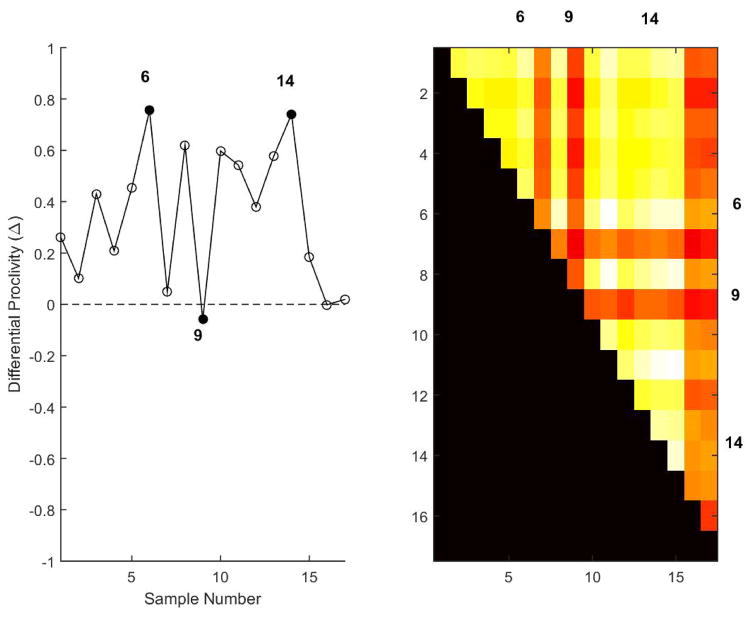
Figure 3.
Average differential proclivity estimates of the periodontitis test samples (N = 17) is shown on the left averaged over (N = 100) independent realizations. Three representative samples (6, 14, 9) with varying differential proclivities are shown in dark circles (left). Dashed line represents samples with equal proclivity to periodontitis and non-periodontitis groups with dark and white arrows representing increasing proclivity to periodontitis and non-periodontitis groups. Samples 6 and 14 have similar differential proclivities (Δ ~ 0.75) in contrast to that of the borderline sample 9 (Δ ~ 0).

