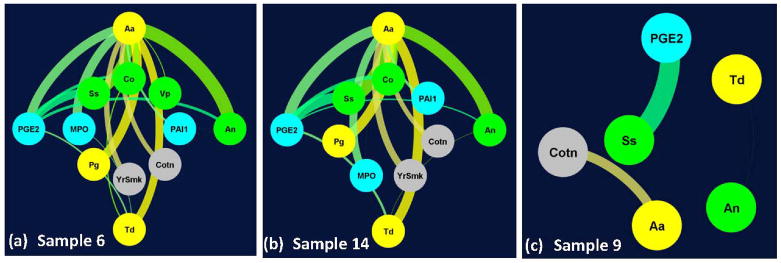
Figure 4.
Patient-specific networks for representative periodontitis test samples (6, 14) shown in (a, b) had markedly different topology from that of sample 9 (c). For clarity, variables corresponding to (i) pathogenic bacteria Aggregatibacter actinomycetemcomitans (Aa), Porphyromonas gingivalis (Pg), Treponema denticola (Td), (ii) commensal bacteria Streptococcus sanguinis (Ss), Actinomyces naeslundii (An), Veillonella parvula (Vp), Capnocytophaga ochracea (Co), (iii) molecular markers interleukin 1β (IL1b), prostaglandin E2 (PGE2), plasminogen activator inhibitor-1 (PAI-1), myeloperoxidase (MPO) and (iv) other markers corresponding to years of smoking (Yrs), salivary cotinine level (Cot) and age (Age) are shown in yellow, green, cyan and gray colors in (a, b, c) respectively. Each edge corresponds to a classifier with its thickness proportional to the classifier confidence in each of the subplots. For clarity, only edges corresponding to classifiers whose confidence > 40% is shown in (a, b, c). In (a) and (b) the top four highly connected nodes (Aa, PGE2, An, Td) are shown in the outer circle.

