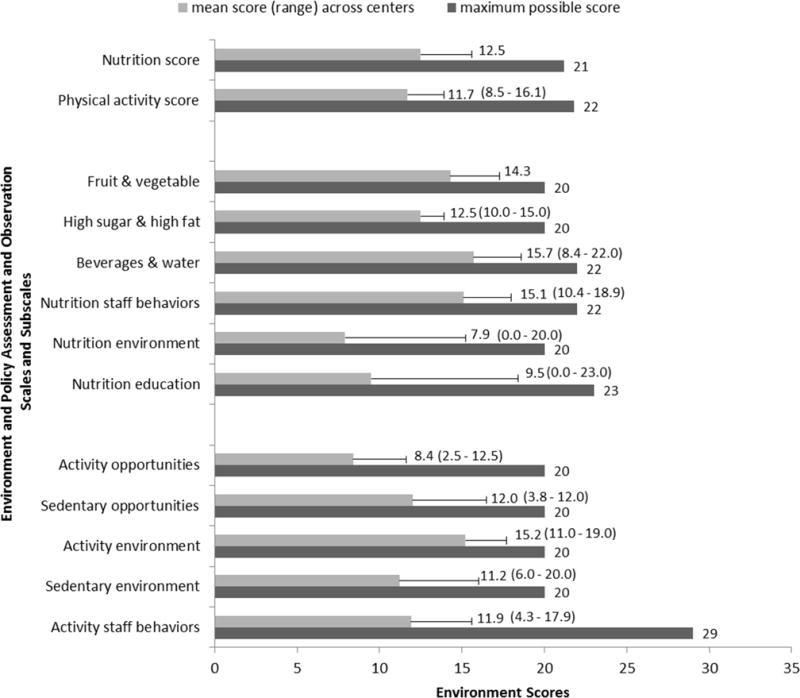
Figure 1. Obesogenic Environment Scores (mean across centers, range, and maximum possible score), from the Environment and Policy Assessment Observation, for 11 American Indian Child Care Centers Across Oklahoma in 2012.

aScales and score represent the Environment and Policy Assessment Observation (EPAO) tool. As conventionally utilized and described in Ward et al.,48 observation item responses on the EPAO observation were converted from their raw responses to a 3-point scale (0, 1, and 2), averaged within a given subscale, and multiplied by 10, with the average of all subscale scores representing the respective nutrition or physical activity scale score.
