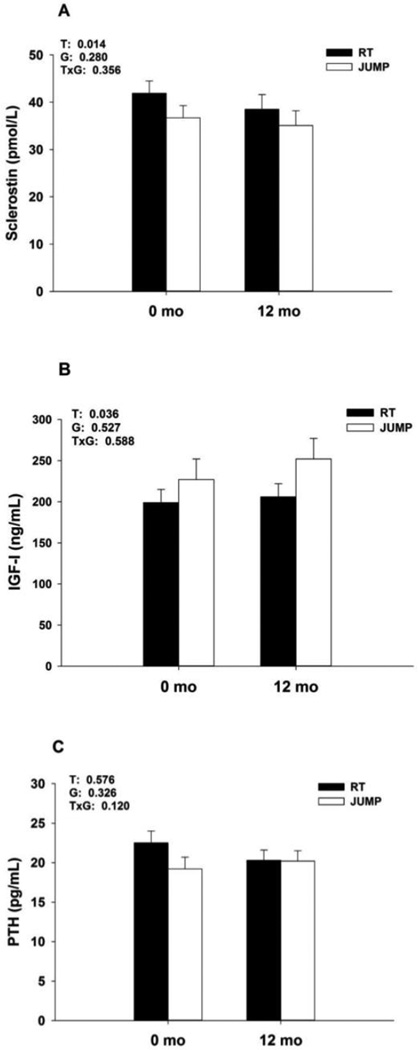
Figure 1.
Concentrations of sclerostin (A), IGF-I (B), and PTH (C) (means ± SEM) after 0 and 12 months of RT or JUMP. Significant time main effect for sclerostin and IGF-I; post hoc within group comparisons were not performed as there were no significant time-by-group interactions. Means with different letter superscripts are significantly different.

