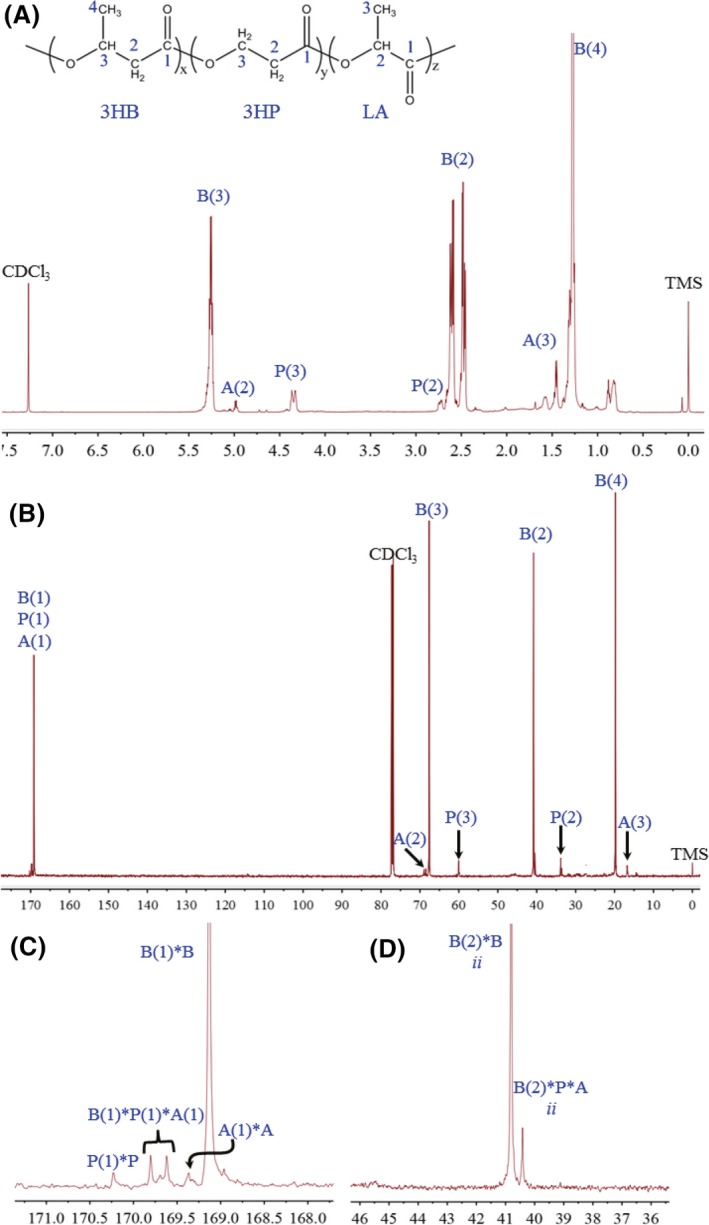
Figure 3.

NMR analysis of PLBP terpolyester. 1H NMR spectra (A) and 13C NMR spectra (B) of random copolyester P(3HB‐co‐3HP‐co‐LA) containing 90.41 mol% 3HB, 7.78 mol% 3HP and 1.81 mol% LA, respectively, and its expanded 13C NMR spectra of carboxyl carbon [B(1), P(1), A(1)] area (C) and methylene regions (D) in the terpolyester. B, P and A refer to 3HB, 3HP and LA; numbering schemes were the same as molecular formulations of polyester indicated in the inset in (A). N*M represents the interaction of monomer N and M. “i” indicates “isotactic.” Chemical shifts are in ppm and tetramethylsilane (TMS) was employed as an internal chemical shift standard.
