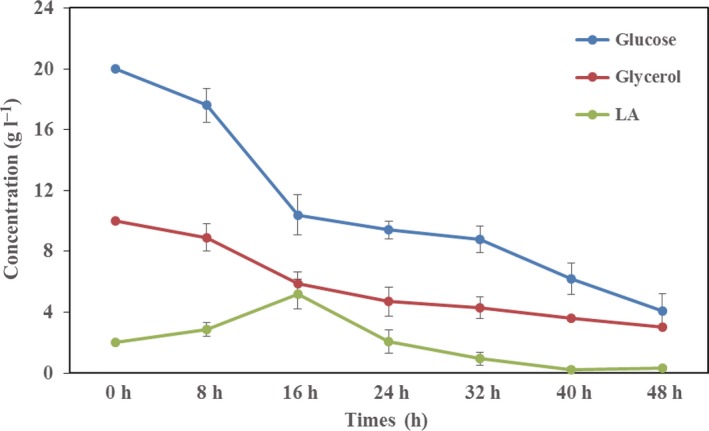
Figure 4.

The concentration of glucose, glycerol and lactate in shake‐flask studies. E. coli S17‐1 ΔpflA harbouring two plasmids of pLA' and p3HP2p was cultured in LB medium supplemented with 20 g L−1 glucose, 10 g L−1 glycerol and 2 g L−1 lactate. Blue line, glucose; red line, glycerol; green line, lactate. Error bars represent the standard deviation of experiments conducted in triplicates.
