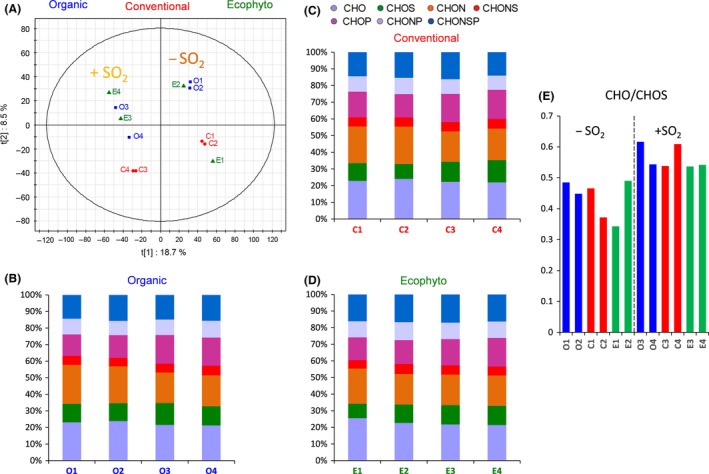
Figure 7.

Analysis of the FT‐ICR‐MS data for wines of 2013 vintage. (A) Scores plot of the PLS‐DA depending on the use of SO2, the first two components retained 27.2% of the variation. Histograms of elementary composition of Organic (B), (C) Conventional and (D) Ecophyto wines. (E) Ratio of CHOS/CHO masses for each analysed wine.
