Figure 8.

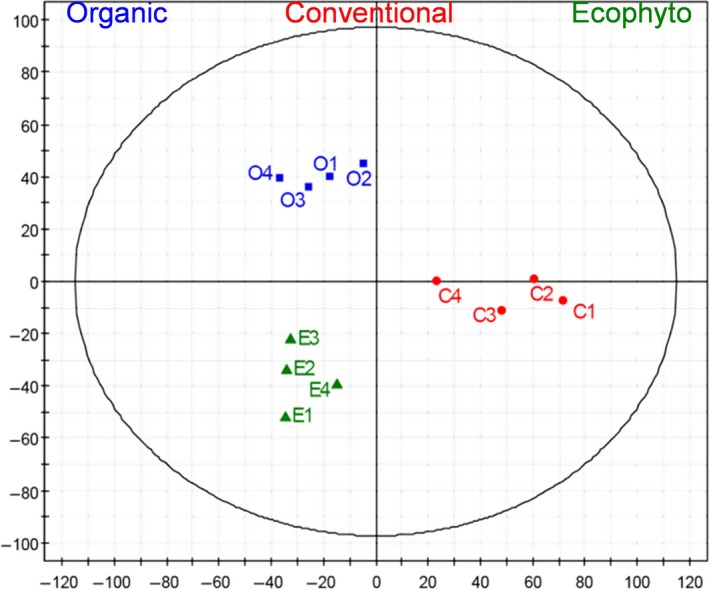
Analysis of the FT‐ICR‐MS data for wine of 2013 vintage. Scores plot of the PLS‐DA depending on phytosanitary protection mode, the first two components retained 29.4% of the variation.

Analysis of the FT‐ICR‐MS data for wine of 2013 vintage. Scores plot of the PLS‐DA depending on phytosanitary protection mode, the first two components retained 29.4% of the variation.