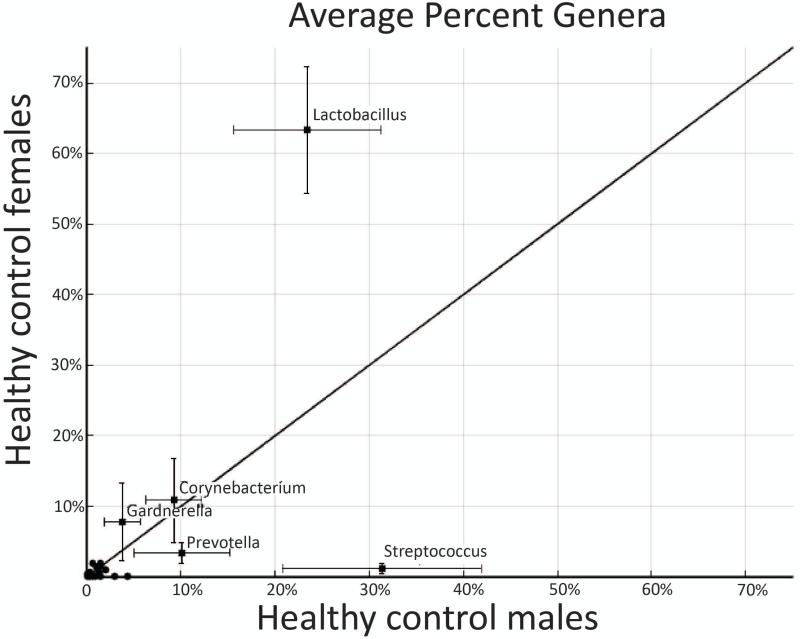
Figure 1. Healthy control male vs. female urinary microbiomes.
The xy graph plots the average percent genera in healthy control (HC) males vs. HC females. The error bars at each point represent the standard error. The diagonal line represents the line of no difference between the two sexes. There was a statistically higher percentage of Lactobacillus in females compared to males (p=0.01). Alternatively, there was statistically higher amount of Streptococcus in males (p=0.006).

