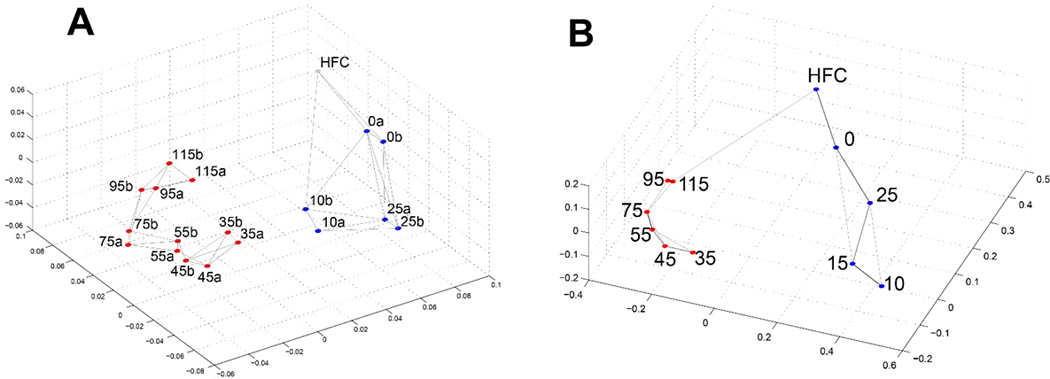
Figure 2. Multidimensional scaling of temporal A) mRNA and B) miRNA expression profiles.

Pairwise sample Pearson correlation is mapped into distance as 1-correlation. Pre- and post-neuronal induction time points are marked as blue and red dots, respectively. HFC is human fibroblast cell before reprogramming
