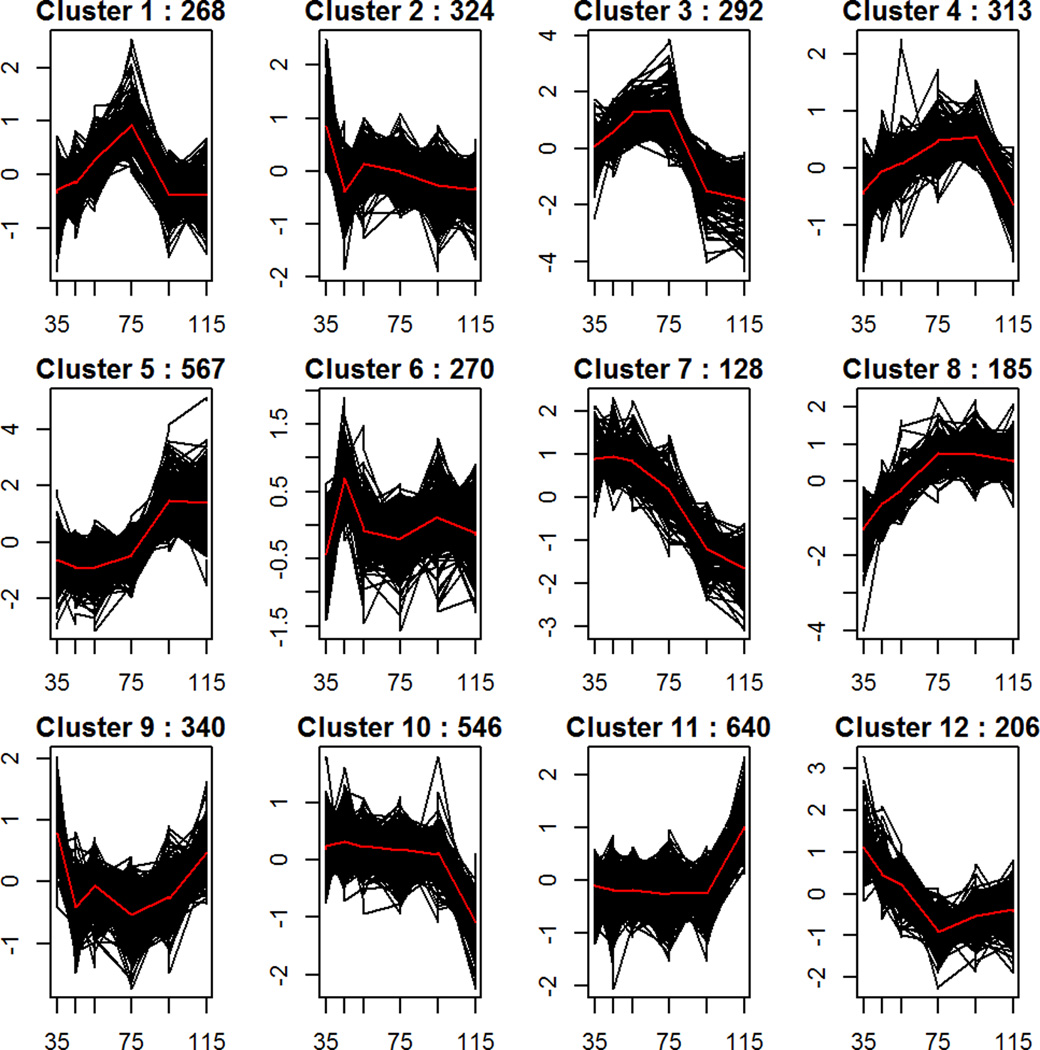
Figure 6. K-means cluster analysis of expression profiles across neuronal maturation Days 35–115.

Calinski and Silhouette index evaluation indicated 12 clusters as optimum to distinguish the 4079 genes that displayed significant differential expression (adjusted p-value<.01, absolute fold change>2) between at least two time points. The number of genes falling into each cluster are shown at the top of each plot. The y-axis plots the expression of each transcript centered and scaled so that each gene will have mean 0 and sd 1. The x axis plots days in culture. Cluster 1 showed statistically significant enrichment for BMI GWAS-implicated genes.
