Abstract
Events responsible for cerebrovascular disease in diabetes are not fully understood. Pericyte loss is an early event that leads to endothelial cell death, microaneurysms, and cognitive impairment. A biochemical mechanism underlying pericyte loss is rapid respiration (oxidative metabolism of glucose). This escalation in respiration results from free influx of glucose into insulin-insensitive tissues in the face of high glucose levels in the blood. Rapid respiration generates superoxide, the precursor to all reactive oxygen species (ROS), and results in pericyte death. Respiration is regulated by carbonic anhydrases (CAs) VA and VB, the two isozymes expressed in mitochondria, and their pharmacologic inhibition with topiramate reduces respiration, ROS, and pericyte death.
Topiramate inhibits both isozymes; therefore, in the earlier studies, their individual roles were not discerned. In a recent genetic study, we showed that mitochondrial CA VA plays a significant role in regulation of reactive oxygen species and pericyte death. The role of CA VB was not addressed.
In this report, genetic knockdown and overexpression studies confirm that mitochondrial CA VA regulates respiration in pericytes, whereas mitochondrial CA VB does not contribute significantly. Identification of mitochondrial CA VA as a sole regulator of respiration provides a specific target to develop new drugs with fewer side effects that may be better tolerated and can protect the brain from diabetic injury. Since similar events occur in the capillary beds of other insulin-insensitive tissues such as the eye and kidney, these drugs may also slow the onset and progression of diabetic disease in these tissues.
Keywords: Apoptosis, Brain peicytes, Diabetes, Mitochondrial carbonic anhydrases, Reactive oxygen species
1. INTRODUCTION
Hyperglycemia-induced diabetic complications of the brain include pericyte loss [1,2], microaneurysms [3,4], and cognitive impairment [5–7]. Pericytes in close proximity to endothelial cells are vital to the integrity and function of cerebral microvasculature. High blood glucose levels lead to intracellular hyperglycemia [8], rapid respiration (oxidative metabolism of glucose) [9], and pathologic levels of superoxide in pericytes from insulin-insensitive tissues such as brain [8]. Superoxide is the precursor to all reactive oxygen species (ROS) [10] and causes pericyte apoptosis [11,12]. Pericyte death leads to endothelial cell death, microaneurysms, and cognitive decline [5–7].
Carbonic anhydrases (CAs) IX and XII were recently implicated in ischemia-induced cerebrovascular pathology [13]. We previously showed that genetic knockout [14] and pharmacological inhibition [1,2] of mitochondrial carbonic anhydrases (CA), VA and VB, the two isozymes expressed in mitochondria [14], reduce respiration [9], ROS [9,12], and pericyte apoptosis [11,12]. Topiramate, the pharmacologic inhibitor of mitochondrial CAs [15,16], used in earlier studies, is in clinical use for other diseases [17–19] and can be used for this new indication in translational research. Since topiramate is not well tolerated by many patients, it is imperative to develop newer drugs with fewer side effects. One way of accomplishing this goal is to identify specific targets for drug development. Topiramate inhibits both mitochondrial CAs; therefore, the individual roles of the two isozymes were not discerned. More recently, we published data collected using genetic techniques that identified mitochondrial CA VA [11] as a potential target to treat diabetic brain injury.
In this report, we present novel data confirming a major role of mitochondrial CA VA in the regulation of ROS and pericyte apoptosis. The genetic knockdown of mitochondrial CA VA significantly reduced high glucose-induced ROS and apoptosis in pericytes, the two parameters of diabetic injury. The other isozyme, mitochondrial CA VB, seems inconsequential since its overexpression and knockdown had no effect on either parameter of diabetic injury.
The identification of mitochondrial CA VA as a major contributor to brain diabetic disease may lead to novel strategies to prevent diabetic complications in the brain and possibly in other insulininsensitive tissues such as eye and kidney.
2. Materials and Methods
2.1. Cell culture
Conditionally immortalized mouse brain pericyte (BPC) cultures were established as previously described [12]. The pericytes were grown in 60 mm petri dishes in growth media (DMEM, D6046, Sigma–Aldrich, Saint Louis, MO) supplemented with 10% fetal bovine serum, 2 mM L-glutamine, penicillin/streptomycin (Sigma–Aldrich), and murine recombinant interferon-γ at 44 U/ml (R&D Systems, Minneapolis, MN) in an atmosphere of 5% CO2 at 33°C. The cells were fed every 2–3 days.
2.2. Knockdown of mitochondrial CA VA and CA VB in the brain pericytes
Small interfering RNAs (siRNA) for the mitochondrial CA VA and CA VB genes (OriGene Technologies, Rockville, MD) were used to transiently transfect pericytes, according to the manufacturer’s instructions. The siRNAs were used at 10 nM with siRNA Transfection reagent (siTran, OriGene Technologies Rockville, MD). The siRNA that resulted in more than 50% decline in expression of the respective genes were given to Blue Heron Biotech (Bothell, WA) for subcloning into pSicoRpuro vector [20] to generate shRNA plasmids. The pSicoRpuro vector lacks a simian virus (SV40) origin. The commercially available shRNAs are subcloned into vectors containing an SV40 origin and are not recommended for transfection of immortalized cells containing large T antigen, as described in our earlier publication [11] and later in materials and methods (see 2.3.1. Plasmid preparation). These shRNA plasmids were used to produce stable pericyte cell lines as follows: The day before transfection, the cells were plated on 6-well plates at 50% confluence in growth medium. The transfections were as described earlier for siRNA. Cells were harvested 28 hours after the transfection. Individual clones were selected by serial dilutions with 4 μg/ml puromycin (Sigma-Aldrich, Saint Louis, MO). Media was changed every 2–3 days. Expression of mitochondrial CA VA and CA VB mRNAs were determined by quantitative real-time PCR (qRT-PCR) as described previously [11]. Briefly, total RNA was isolated from cultured pericytes using the RNeasy kit (QIAGEN, Valencia, CA). For mRNA quantification, complementary DNAs (cDNAs) were synthesized using the SuperScript III First-Strand Synthesis System (Invitrogen, Carlsbad, CA) according to the manufacturer’s instructions. Quantitative RT-PCR analysis was performed in triplicate dishes of cells using Power SybrGreen reagent (Applied Biosystems, Carlsbad, CA) in a LightCycler-480 (Roche, Basel, Switzerland). The levels of mRNA were normalized to 36B4 as a housekeeping gene and calculated using the comparative ΔΔCt method.
The sequences of the primer used were: mitochondrial CA VA forward primer 5′-GTC TCC CAT CAA CAT CCA-3′ and reverse primer 5′-GGA AGA AGT AGC CAG TGT-3′; mitochondrial CA VB forward primer 5′-AAT GGC TTG GCT GTG ATA G-3′ and reverse primer 5′-GTG TCC TTG TGC TTA ATT GAT G-3′; and 36B4 forward primer 5′-CAC TGG TCT AGG ACC CGA GAA G-3′ and reverse primer 5′-GGT GCC TCT GGA GAT TTT CG-3′.
The levels of mitochondrial CA VA and CA VB proteins were assessed by immunoblot by standard procedures as previously described [1]. Briefly, cultured cells were homogenized in lysis buffer [25 mM Tris (pH 7.5), 0.15 M NaCl, 1 mM PMSF], sonicated, and cleared by centrifugation. Protein concentration in the final supernatants was determined by BCA Protein Assay (Pierce, Rockford, IL). The proteins (25 μg) were separated on NuPAGE Novex 4–12% Bis-Tris reducing gels (ThermoFisher Scientific, Waltham, MA) and then transferred to nitrocellulose membranes. The membranes were incubated with primary antibodies overnight at 4°C followed by blocking with 5% non-fat milk. Rabbit anti mouse CA VA carboxyl terminal (C-tail) antibodies were the same as described [21]. Affinity-purification was accomplished with a C-tail CA VA peptide-Affigel 10 column [14]. Rabbit anti mouse CA VB C-tail antibodies and affinity-pure anti-CA VB C-tail–specific IgG were as described [22]. The titer and specificity of these affinity purified antibodies was ascertained by western blotting [14]. Anti-gamma-tubulin antibodies were from Cell Signaling Technology (MA1-850, Danvers, MA). Horseradish peroxidase-conjugated secondary antibodies, goat anti-rabbit and goat anti-mouse were for mitochondrial CAs and gamma-tubulin, respectively. Band visualization was by chemiluminescent substrate (Pierce, Rockford, IL). The quantitative estimation was obtained using ImageJ software.
Once established, mitochondrial CA VA knockdown brain pericytes (CA VA KD-BPC) and CA VB knockdown brain pericytes (CA VB KD-BPC) were maintained in puromycin containing media.
2.3. Overexpression of mitochondrial CA VB in the brain pericytes
As we previously published for mitochondrial CA VA [11], we developed a mitochondrial CA VB overexpressing cell line (CA VB-BPC) to show the effect of overexpression of mitochondrial CA VB on pericyte ROS and apoptosis.
2.3.1. Plasmid preparation
The construct for mitochondrial CA VB was designed as we described previously for mitochondrial CA VA [11]. Briefly, a 1201 base pair coding sequence of mitochondrial CA VB cDNA was directionally cloned into the pDream2.1 mammalian expression vector (GenScript, Piscataway, NJ) at Bam HI/Hind III sites. The pDream vector was selected because it lacks an SV40 origin. Immortalized pericytes express large T antigen and a plasmid with an SV40 origin is not suitable for stable transfection of such cells. DNA rearrangements, such as deletions and duplications found within and near the integrated SV40 DNA in cells overexpressing large T antigen, change the cells morphologically and physiologically [23].
2.3.2 Transfection
The BPC were transfected with jetPRIME transfection reagent (Polyplus-transfection, Illkirch, France) according to supplier’s protocol. At 55 hours post transfection, cells were incubated in growth media containing 4 μg/ml puromycin (Sigma–Aldrich) to select for mitochondrial CA VB overexpressing cells. Media was changed every 2–3 days. Expression of mitochondrial CA VB mRNA was determined by qRT-PCR and the level of mitochondrial CA VB protein was assessed by immunoblot as described previously [1] and in section 2.2. Once established, mitochondrial CA VB overexpressing cells (CA VB-BPC) were maintained in puromycin containing media.
2.4. Reactive Oxygen Species (ROS) analysis
Intracellular ROS were measured with a ROS activity assay kit (Cell Meter™ Fluorimetric Intracellular Total ROS activity assay kit, cat# 22900, AAT Bioquest, Thermo Fisher Scientific, Inc., Waltham, MA) as described previously [9]. Briefly, the cells were seeded in Costar black wall/clear bottom 96-well plates at a density of 1×10⁵ cells per well in 100 μl of growth media containing normal glucose (5.7 mM), and were allowed to adhere overnight in a 5% CO2, 37°C incubator. The following morning, 100 μl of glucose stock solution (1 M) was added to bring the final concentration of glucose to 40.7 mM (high glucose). Assay loading solution (100 μl) was immediately added to each well and the incubations were continued in a 5% CO2, 37°C incubator for 1 hour. Fluorescence at excitation and emission wavelengths of 490 and 520 nm, respectively, were measured using a fluorescence plate reader (Tecan Safire II, Tecan, Männedorf, Switzerland). Hydrogen peroxide was used as a positive control and Tempo as a negative control per the supplier’s instructions. The ROS produced are presented as a percent of control. Each sample was run in triplicate and experiments were repeated at least three times.
2.5. Cell viability
A Cell Meter™ Cell Viability Assay Kit (cat#22784, AAT Bioquest, Thermo Fisher Scientific, Inc.) was used to determine cell viability as described previously [9]. Briefly, the cells were seeded in the wells of a Costar black wall/clear bottom 96-well plate and treated with normal glucose and high glucose, as described earlier. Following the treatment, the CytoCalcein Violet 450 AM dye-loading solution (100 μl) was added and the cells were incubated in a 5% CO2, 37°C incubator for 1 hour. Fluorescence intensity was measured on a fluorescence plate reader (Tecan Safire II) at excitation and emission wavelengths of 405 nm and 460 nm, respectively. The data is expressed as percentage of cell viability compared to viable cells in the control. Each sample was run in triplicate and experiments were repeated at least three times.
2.6. Apoptosis
Apoptotic cell death was determined by TUNEL (Terminal deoxynucleotidyl transferase-dUTP nick end labeling) assay. The pericytes were grown for 5 days on chamber slides (Millicell®EZSLIDE, EMD Millipore, Darmstadt, Germany) under normal glucose and high glucose conditions. Following incubation, cells were fixed with 4% paraformaldehyde for 15 min at room temperature and washed with PBS twice. TUNEL staining was performed using Click-iT® TUNEL Alexa Fluor® 594, as recommended by the supplier (Invitrogen, Carlsbad, CA). Cells were counterstained with DAPI (Electron Microscopy Sciences, Hartfield, PA) for the nuclei and photographed using a Zeiss fluorescence microscope (Axiophot, Zeiss, Germany) equipped with a digital camera. TUNEL-positive cells were counted and calculated as a percentage of the total cells. The results are from three independent experiments.
2.7. Statistical analysis
All means are reported with their n and SEM. Two means were compared by the unpaired two-tailed Student’s t test. For more than two means, ANOVA, followed by a multiple group comparison test (Newman-Keuls) was used. P<0.05 was considered significant. Statistical analyses were made using GraphPad Prism 7.0 package program (GraphPad Software Inc., San Diego, CA).
3. Results
3.1. Knockdown of mitochondrial CA VA and CA VB in brain pericytes
Figure 1A is an immunoblot of mitochondrial CA VA protein. Knockdown of the CA VA gene reduced the expression of mitochondrial CA VA protein by 87% (Figure 1B) and mRNA by 82% in CA VA KD-BPC compared to the parent BPC.
Figure 1. Immunoblot analysis of mitochondrial CA VA and CA VB proteins in brain pericytes.
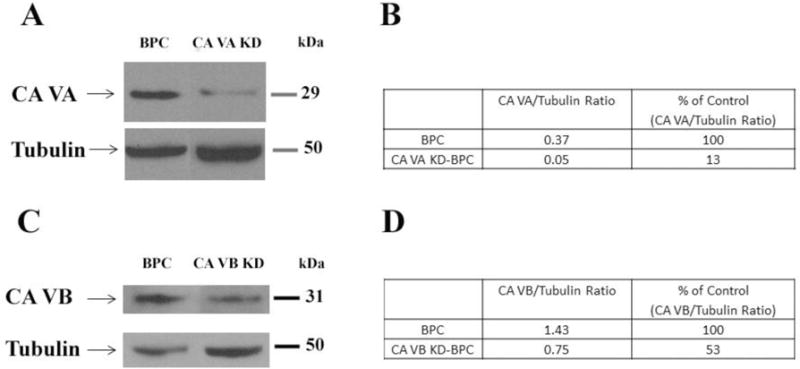
A)Representative Western blots for mitochondrial CA VA and tubulin in BPC and CA VA KD-BPC. B) Quantification of mitochondrial CA VA protein. C) Representative Western blots for mitochondrial CA VB and tubulin in BPC and CA VB KD-BPC. D) Quantification of mitochondrial CA VB protein. Tubulin is the loading control. BPC, brain pericytes; CA VA KD-BPC, CA VA knockdown brain pericytes; CA VB KD-BPC, CA VB knockdown brain pericytes.
Figure 1C is an immunoblot of mitochondrial CA VB protein. Knockdown of the CA VB gene showed 47% less mitochondrial CA VB protein (Figure 1D) and 38% less mRNA in CA VB KD-BPC, compared to the parent BPC.
3.2. Overexpression of mitochondrial CA VB in brain pericytes
Mitochondrial CA VB overexpressing (CA VB-BPC) stable pericytes, engineered as described previously for mitochondrial CA VA overexpressing cells [11], showed 51% more mitochondrial CA VB protein compared to parent BPC (Figure 2B and 2C). There was a 4-fold increase in the mRNA. Overexpression did not change the morphology of the cells (Figure 2A).
Figure 2. Comparison of mitochondrial CA VB protein between BPC and CA VB-BPC.
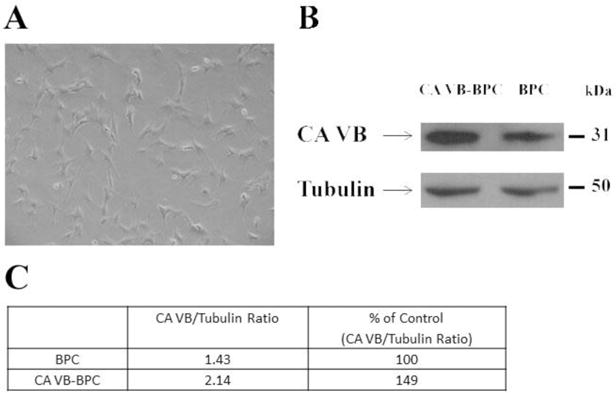
A) Light microscopic image of mitochondrial CA VB-BPC. B) Representative Western blots for mitochondrial CA VB and tubulin in BPC and CA VB-BPC. C) Quantification of mitochondrial CA VB protein. Tubulin is the loading control. BPC, brain pericytes; CA VB-BPC, CA VB overexpressing brain pericytes.
3.3. Effect of knockdown of mitochondrial CA VA and CA VB on ROS in brain pericytes
Figure 3A shows a significant decrease in high glucose-induced ROS in CA VA knockdown cells (CA VA KD-BPC, 73.5±3.8 vs. BPC, 100±6.7, p<0.01). High glucose-induced ROS did not decline in CA VB KD-BPC.
Figure 3. Effect of mitochondrial CA VA and CA VB knockdown on high glucose-induced intracellular ROS in pericytes.
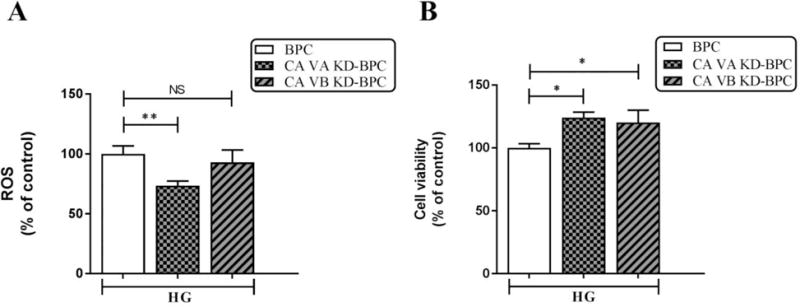
A) ROS. B) Cell viability. Results are presented as percentage of BPC treated with HG. Data are shown as mean ± SEM (n=4–8). The graphs are representative of three independent experiments. *p<0.05, **p<0.01. BPC, brain pericytes; CA VA KD-BPC, CA VA knockdown brain pericytes; CA VB KD-BPC, CA VB knockdown brain pericytes; HG, high glucose; NS, not significant.
The cell viability of CA VA KD-BPC, CA VB KD-BPC, and BPC groups was preserved during the duration of the assay (Figure 3B).
3.4. Effect of mitochondrial CA VA and CA VB knockdown on pericyte apoptosis
High glucose-induced apoptosis was significantly reduced (55%) in response to knockdown of CA VA (Figure 4). Knockdown of CA VB showed a 20% decline in apoptosis (Figure 4) that did not reach significance.
Figure 4. Effect of mitochondrial CA VA and CA VB knockdown on apoptosis in pericytes.
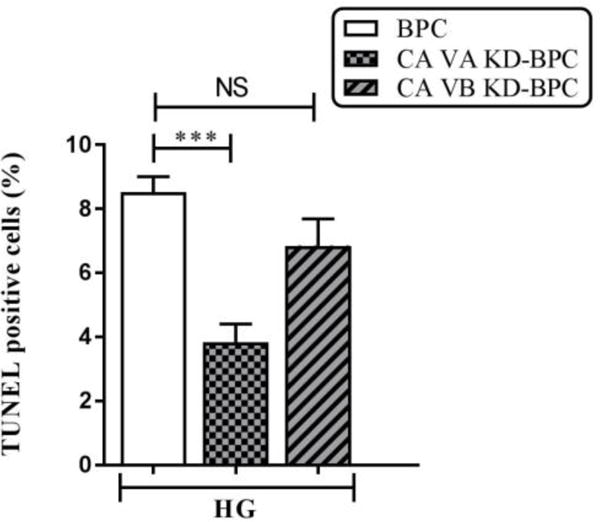
Percentages of apoptotic cells with respect to total DAPI (blue)-stained cells were calculated from 5 independent fields of 100 cells each. The values are expressed as mean ± SEM (n=4–5). The graphs are representative of three independent experiments. Evaluation was performed by a researcher blinded to the experimental protocol. *** p<0.001. BPC, brain pericytes; CA VA KD-BPC, CA VA knockdown brain pericytes; CA VB KD-BPC, CA VB knockdown brain pericytes; HG, high glucose; NS, not significant.
3.5. Effect of overexpression of mitochondrial CA VB on high glucose-induced ROS in pericytes
High glucose induced ROS (Figure 5A) in both BPC (NG, 100±10.8 vs HG, 210.3±10.3, p<0.001) and CA VB-BPC (NG, 78.2±10.8 vs. HG, 238.5±9.5, p<0.001). However, the ROS in CA VB-BPC were not different than the ROS in parent BPC (HG, 210.3±10.3 vs. HG, 238.5±9.5, ns). On the other hand, the CA VA overexpression caused a significant increase in high glucose-induced ROS (Figure 5A inset), as we published previously [11].
Figure 5. Effect of mitochondrial CA VB overexpression on high glucose-induced ROS in pericytes.
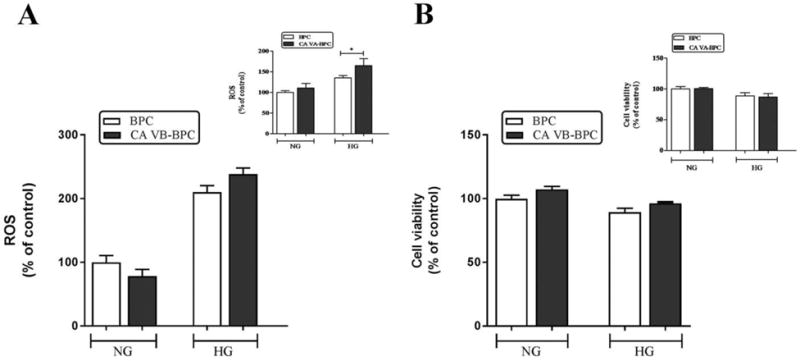
A) ROS. B) Cell viability. Insets are the results published previously for CA VA overexpression on ROS and cell viability. Results are presented as percentage of BPC treated with NG. Data are shown as mean ± SEM (n=3–7). The graphs are representative of three independent experiments. *p<0.05. BPC, brain pericytes; CA VA-BPC, CA VA overexpressing brain pericytes; CA VB-BPC, CA VB overexpressing brain pericytes; HG, high glucose; NG, normal glucose.
BPC and CA VB-BPC (Figure 5B) remained viable throughout the duration of the ROS determination assay. The inset shows the effect of CA VA overexpression on cell viability as presented in our previous publication.
3.6. Effect of mitochondrial CA VB overexpression on pericyte apoptosis
As shown in Figure 6, there was a significant increase in high glucose-induced apoptosis of both BPC and CA VB-BPC. However, there was no significant difference in the number of apoptotic cells in BPC and CA VB-BPC.
Figure 6. Effect of mitochondrial CA VB overexpression on apoptosis.
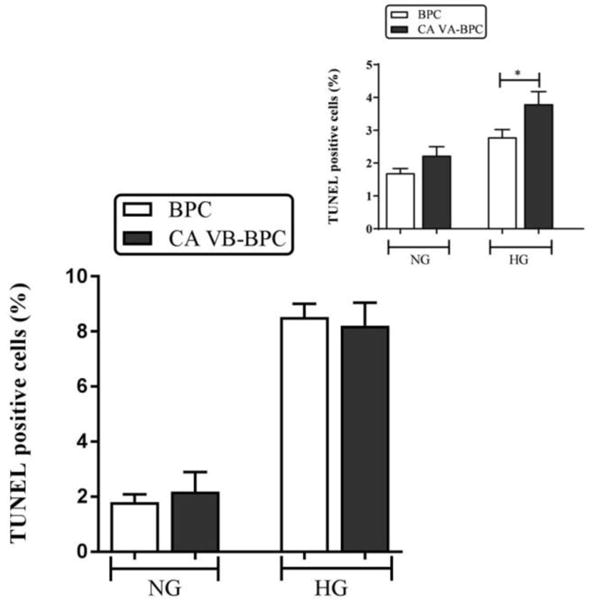
Percentages of apoptotic cells with respect to total DAPI (blue)-stained cells were calculated from 5 independent fields of 100 cells. The values are expressed as mean ± SEM (n=4–8). The graphs are representative of three independent experiments. Evaluation was performed by a researcher blinded to the experimental protocol. *p<0.05. BPC, brain pericytes; CA VA-BPC, CA VA overexpressing brain pericytes; CA VB-BPC, CA VB overexpressing brain pericytes; HG, high glucose; NG, normal glucose.
We previously observed a significant increase in apoptotic cells in overexpressing CA VA-BPC (Figure 6 inset) [11].
5. DISCUSSION
Respiration (oxidative metabolism of glucose) generates ATP and superoxide is a byproduct. Superoxide is the precursor to all ROS. Physiological levels of ROS are essential for defenses of the body and small fluctuations in the steady-state concentration may play a role in intracellular signaling [24]. Uncontrolled increases lead to free radical mediated chain reactions that target proteins [25], lipids [26], polysaccharides [27], and DNA [28,29], and cause cell death [1,2]. The following is a brief description of respiration: Glucose is metabolized to pyruvate in the cytoplasm; pyruvate enters the mitochondria and combines with bicarbonate (HCO−3) to form oxaloacetate, a key enzyme in the oxidative metabolism of glucose; oxaloacetate enters the Krebs cycle and generates FADH2 and NADH. These electron donors are carried to electron transport chain reactions to generate ATP and superoxide. In diabetes, a constant influx of glucose in relatively insulin-insensitive tissues such as brain [8] causes an overproduction of ROS as follows: The excess electron donors produced during the Krebs cycle generate high mitochondrial membrane potential by pumping protons across the inner mitochondrial membrane (Figure 7). The high mitochondrial membrane potential inhibits electron transport at complex III and increases the half-life of the free radical intermediate of coenzyme Q, which reduces O2 to superoxide. Mitochondrial CAs provide HCO−3 by catalyzing the reversible hydration of CO2 (Figure 7). As mitochondrial membranes are impermeable to HCO−3, this essential molecule cannot be imported. Our published data show that inhibition of mitochondrial CAs reduce respiration, ROS, and diabetic damage to the brain [1,2,9,12].
Figure 7.
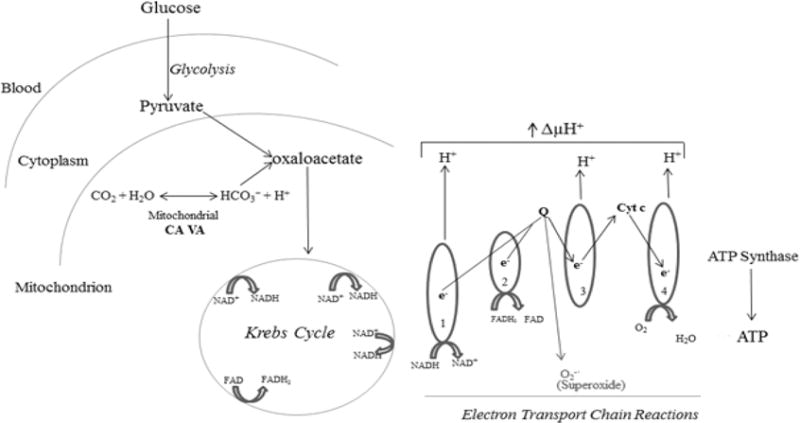
Role of mitochondrial CA in ROS production and apoptosis in brain pericytes.
The significance of mitochondrial CAs in diabetic disease of the central nervous system was recognized upon observing that mitochondrial CAs double knockout mice exhibited reduced oxidative stress in the brain and pharmacological inhibition of these enzymes reduce hyperglycemia-induced pericyte loss in the diabetic mouse brain [1,2]. Pericytes in the microvasculature of the brain are vital to the integrity and function of endothelial cells. Pericyte loss in the brain results in endothelial cell death, microaneurysms [3,4], and cognitive decline [5–7]. CAs are zinc-containing metaloenzymes that catalyze the reversible hydration of carbon dioxide according to the following reaction: CO2 + H2O↔HCO3− + H+. This reaction forms the basis for the regulation of acid–base balance in organisms. In addition to this main function, CAs participate in a number of other physiological processes, such as CO2 and HCO3− transport, bone resorption, production of body fluids, gluconeogenesis, ureagenesis, lipogenesis [30,31], and respiration [9]. During evolution, at least 12 active CA isoenzymes have emerged in both rodents and humans. The isoenzymes have differences in their tissue distribution, kinetic properties, and subcellular localizations: CAs I, II, III, VII, and XIII [31] are cytoplasmic, CAs IV, IX, XII, and XIV [32–35] are membrane-bound, CA VI is secreted [36], and CA VA and VB are located in mitochondria [14].
Our earlier in vitro and in vivo studies with topiramate [16] showed a significant role of mitochondrial CAs in hyperglycemia-induced escalation in respiration, ROS, and pericyte death [1,2,9,14]. Topiramate is in clinical use for other diseases [17–19,37–41] and can be used to prevent diabetic damage to the brain. One consideration is that topiramate has significant side effects and is not well tolerated [18]. Although we have shown that topiramate effectively protects cerebral pericytes from diabetic damage at a much lower dose compared to those ones used for other diseases [2], it is imperative to develop new drugs with even fewer side effects. One way to accomplish this goal is to identify which of the two mitochondrial CA isoforms contributes to major damage to the brain in diabetes and then use topiramate as a backbone to develop drugs to specifically target this particular isoform. Topiramate inhibits both mitochondrial CA VA and CA VB; therefore, it is not possible to discern the individual roles of the two isoforms. In a more recent report, we used genetic approaches to address this issue. Overexpression of mitochondrial CA VA increased high glucose-induced ROS and apoptosis in cerebral pericytes, thus identifying a significant role of CA VA in diabetic damage [11]; however, this study did not address the contribution of mitochondrial CA VB.
In the current report, we present further evidence that CA VA is a major player in diabetic injury to the brain. Knockdown of CA VA reduced high glucose-induced ROS and apoptosis in pericytes (Figure 3), which is consistent with the overexpression results [11]. Mitochondrial CA VB, on the other hand, was inconsequential in affecting either parameter of diabetic damage to the brain. The mitochondrial CA VB-BPC showed a 4-fold increase in mRNA and a 50% increase in CA VB protein, showing a high translational efficiency of CA VB mRNA. This significant increase in mitochondrial CA VB protein did not affect pericyte ROS (Figure 5A) and apoptosis (Figure 6) significantly. The CA VB KD-BPC expressed 38% of the wild type CA VB mRNA (Figure 1C) and 47% of the protein (Figure 1D). The reduced levels of CA VB had no effect on ROS (Figure 3A) and apoptosis (Figure 4), which was consistent with our overexpression results. Despite repeated attempts, we were unable to engineer CA VB pericytes expressing less than the levels of CA VB mRNA and protein reported above, indicating that mitochondrial CA VB is most likely engaged in a different metabolic pathway vital to the survival of pericytes.
The confirmation that mitochondrial CA VA alone protects the brain from diabetic injury would give impetus to development of drugs targeted against this particular isoform. These drugs will have fewer side effects and may be better tolerated. Events similar to the ones caused by hyperglycemia-induced damage in the brain capillaries also occur in the microvasculature of other tissues [42]. Loss of pericytes in retinal microvasculature precedes endothelial cell death and blindness [43,44]. In the kidney, hyperglycemia-induced renal vascular cell loss [45–47] eventually leads to diabetic kidney disease. These findings will likely spur other studies to determine if this new drug also protects other insulin-insensitive tissues from the microvascular complications of diabetes.
Highlights.
Mitochondrial CA VA (mCA VA) genetic knockdown decreases pericyte ROS and apoptosis
Overexpression of mCA VA, on the other hand, increases pericyte ROS and apoptosis
Genetic alterations in mCA VB expression do not affect pericyte ROS and apoptosis
mCA VA is a unique target to protect brain microvasculature from diabetic damage
mCA VA inhibition may protect microvasculature of other insulin-insensitive tissues
Acknowledgments
This study was supported by the National Institute of Health grants RO1DK083485, R01 EY022883 and P30 EY016665, Environmental Protection Agency 83573701, an unrestricted departmental award from Research to Prevent Blindness, and Presidential Research Fund Grant 230174. The authors thank Dr. Ángel Baldán (Saint Louis University) for the gift of pSicoRpuro vector and Tracey Baird (Saint Louis University) for editorial assistance. NS is a recipient of Alice R. McPherson-Retina Research Foundation Chair.
Abbreviations
- BPC
brain pericytes
- CAs
carbonic anhydrases
- CA VA-BPC
mitochondrial CA VA overexpressing brain pericytes
- CA VB-BPC
mitochondrial CA VB overexpressing brain pericytes
- CA VA KD-BPC
mitochondrial CA VA knockdown brain pericyte cell line
- CA VB KD-BPC
mitochondrial CA VB knockdown brain pericyte cell line
- HG
high glucose
- NG
normal glucose
- qRT-PCR
quantitative real-time PCR
- ROS
reactive oxygen species
- siRNA
small interfering RNA
- shRNA
small hairpin RNA
- TUNEL
terminal deoxynucleotidyl transferase-dUTP nick end labeling
Footnotes
Publisher's Disclaimer: This is a PDF file of an unedited manuscript that has been accepted for publication. As a service to our customers we are providing this early version of the manuscript. The manuscript will undergo copyediting, typesetting, and review of the resulting proof before it is published in its final citable form. Please note that during the production process errors may be discovered which could affect the content, and all legal disclaimers that apply to the journal pertain.
Conflict of interest
The authors declare that they have no conflicts of interest.
References
- 1.Price TO, Eranki V, Banks WA, Ercal N, Shah GN. Topiramate treatment protects blood-brain barrier pericytes from hyperglycemia-induced oxidative damage in diabetic mice. Endocrinology. 2012;153:362–372. doi: 10.1210/en.2011-1638. [DOI] [PMC free article] [PubMed] [Google Scholar]
- 2.Price TO, Farr SA, Niehoff ML, Ercal N, Morley JE, Shah GN. Protective Effect of Topiramate on Hyperglycemia-Induced Cerebral Oxidative Stress, Pericyte Loss and Learning Behavior in Diabetic Mice. Int Libr Diabetes Metab. 2015;1:6–12. [PMC free article] [PubMed] [Google Scholar]
- 3.Starr JM, Wardlaw J, Ferguson K, MacLullich A, Deary IJ, Marshall I. Increased blood-brain barrier permeability in type II diabetes demonstrated by gadolinium magnetic resonance imaging. J Neurol Neurosurg Psychiatry. 2003;74:70–76. doi: 10.1136/jnnp.74.1.70. [DOI] [PMC free article] [PubMed] [Google Scholar]
- 4.Woerdeman J, van DE, Wattjes MP, Barkhof F, Snoek FJ, Moll AC, Klein M, de Boer MP, Ijzerman RG, Serne EH, Diamant M. Proliferative retinopathy in type 1 diabetes is associated with cerebral microbleeds, which is part of generalized microangiopathy. Diabetes Care. 2014;37:1165–1168. doi: 10.2337/dc13-1586. [DOI] [PubMed] [Google Scholar]
- 5.Huber JD. Diabetes, cognitive function, and the blood-brain barrier. Curr Pharm Des. 2008;14:1594–1600. doi: 10.2174/138161208784705441. [DOI] [PubMed] [Google Scholar]
- 6.Janson J, Laedtke T, Parisi JE, O’Brien P, Petersen RC, Butler PC. Increased risk of type 2 diabetes in Alzheimer disease. Diabetes. 2004;53:474–481. doi: 10.2337/diabetes.53.2.474. [DOI] [PubMed] [Google Scholar]
- 7.Kalaria RN. Neurodegenerative disease: Diabetes, microvascular pathology and Alzheimer disease. Nat Rev Neurol. 2009;5:305–306. doi: 10.1038/nrneurol.2009.72. [DOI] [PubMed] [Google Scholar]
- 8.Balasubramanyam M, Rema M, Premanand C. Biochemical and molecular mechanisms of diabetic retinopathy. Current Science. 2002;83:1506–1514. [Google Scholar]
- 9.Shah GN, Morofuji Y, Banks WA, Price TO. High glucose-induced mitochondrial respiration and reactive oxygen species in mouse cerebral pericytes is reversed by pharmacological inhibition of mitochondrial carbonic anhydrases: Implications for cerebral microvascular disease in diabetes. Biochem Biophys Res Commun. 2013;440:354–358. doi: 10.1016/j.bbrc.2013.09.086. [DOI] [PMC free article] [PubMed] [Google Scholar]
- 10.Liu Y, Fiskum G, Schubert D. Generation of reactive oxygen species by the mitochondrial electron transport chain. J Neurochem. 2002;80:780–787. doi: 10.1046/j.0022-3042.2002.00744.x. [DOI] [PubMed] [Google Scholar]
- 11.Patrick P, Price TO, Diogo AL, Sheibani N, Banks WA, Shah GN. Topiramate Protects Pericytes from Glucotoxicity: Role for Mitochondrial CA VA in Cerebromicrovascular Disease in Diabetes. J Endocrinol Diabetes. 2015;2 doi: 10.15226/2374-6890/2/2/00123. [DOI] [PMC free article] [PubMed] [Google Scholar]
- 12.Shah GN, Price TO, Banks WA, Morofuji Y, Kovac A, Ercal N, Sorenson CM, Shin ES, Sheibani N. Pharmacological inhibition of mitochondrial carbonic anhydrases protects mouse cerebral pericytes from high glucose-induced oxidative stress and apoptosis. J Pharmacol Exp Ther. 2013;344:637–645. doi: 10.1124/jpet.112.201400. [DOI] [PMC free article] [PubMed] [Google Scholar]
- 13.Di Cesare ML, Micheli L, Carta F, Cozzi A, Ghelardini C, Supuran CT. Carbonic anhydrase inhibition for the management of cerebral ischemia: in vivo evaluation of sulfonamide and coumarin inhibitors. J Enzyme Inhib Med Chem. 2016;31:894–899. doi: 10.3109/14756366.2015.1113407. [DOI] [PubMed] [Google Scholar]
- 14.Shah GN, Rubbelke TS, Hendin J, Nguyen H, Waheed A, Shoemaker JD, Sly WS. Targeted mutagenesis of mitochondrial carbonic anhydrases VA and VB implicates both enzymes in ammonia detoxification and glucose metabolism. Proc Natl Acad Sci U S A. 2013;110:7423–7428. doi: 10.1073/pnas.1305805110. [DOI] [PMC free article] [PubMed] [Google Scholar]
- 15.Casini A, Antel J, Abbate F, Scozzafava A, David S, Waldeck H, Schafer S, Supuran CT. Carbonic anhydrase inhibitors: SAR and X-ray crystallographic study for the interaction of sugar sulfamates/sulfamides with isozymes I, II and IV. Bioorg Med Chem Lett. 2003;13:841–845. doi: 10.1016/s0960-894x(03)00029-5. [DOI] [PubMed] [Google Scholar]
- 16.Nishimori I, Vullo D, Innocenti A, Scozzafava A, Mastrolorenzo A, Supuran CT. Carbonic anhydrase inhibitors. The mitochondrial isozyme VB as a new target for sulfonamide and sulfamate inhibitors. J Med Chem. 2005;48:7860–7866. doi: 10.1021/jm050483n. [DOI] [PubMed] [Google Scholar]
- 17.Johnson BA, Ait-Daoud N, Bowden CL, DiClemente CC, Roache JD, Lawson K, Javors MA, Ma JZ. Oral topiramate for treatment of alcohol dependence: a randomised controlled trial. Lancet. 2003;361:1677–1685. doi: 10.1016/S0140-6736(03)13370-3. [DOI] [PubMed] [Google Scholar]
- 18.Rosenfeld WE, Liao S, Kramer LD, Anderson G, Palmer M, Levy RH, Nayak RK. Comparison of the steady-state pharmacokinetics of topiramate and valproate in patients with epilepsy during monotherapy and concomitant therapy. Epilepsia. 1997;38:324–333. doi: 10.1111/j.1528-1157.1997.tb01124.x. [DOI] [PubMed] [Google Scholar]
- 19.Rosenfeld WE, Sachdeo RC, Faught RE, Privitera M. Long-term experience with topiramate as adjunctive therapy and as monotherapy in patients with partial onset seizures: retrospective survey of open-label treatment. Epilepsia. 1997;38(Suppl 1):S34–S36. doi: 10.1111/j.1528-1157.1997.tb04516.x. [DOI] [PubMed] [Google Scholar]
- 20.Ventura A, Meissner A, Dillon CP, McManus M, Sharp PA, Van PL, Jaenisch R, Jacks T. Cre-lox-regulated conditional RNA interference from transgenes. Proc Natl Acad Sci U S A. 2004;101:10380–10385. doi: 10.1073/pnas.0403954101. [DOI] [PMC free article] [PubMed] [Google Scholar]
- 21.Nagao Y, Srinivasan M, Platero JS, Svendrowski M, Waheed A, Sly WS. Mitochondrial carbonic anhydrase (isozyme V) in mouse and rat: cDNA cloning, expression, subcellular localization, processing, and tissue distribution. Proc Natl Acad Sci U S A. 1994;91:10330–10334. doi: 10.1073/pnas.91.22.10330. [DOI] [PMC free article] [PubMed] [Google Scholar]
- 22.Shah GN, Hewett-Emmett D, Grubb JH, Migas MC, Fleming RE, Waheed A, Sly WS. Mitochondrial carbonic anhydrase CA VB: differences in tissue distribution and pattern of evolution from those of CA VA suggest distinct physiological roles. Proc Natl Acad Sci U S A. 2000;97:1677–1682. doi: 10.1073/pnas.97.4.1677. [DOI] [PMC free article] [PubMed] [Google Scholar]
- 23.Hunter DJ, Gurney EG. The genomic instability associated with integrated simian virus 40 DNA is dependent on the origin of replication and early control region. J Virol. 1994;68:787–796. doi: 10.1128/jvi.68.2.787-796.1994. [DOI] [PMC free article] [PubMed] [Google Scholar]
- 24.Droge W. Free radicals in the physiological control of cell function. Physiol Rev. 2002;82:47–95. doi: 10.1152/physrev.00018.2001. [DOI] [PubMed] [Google Scholar]
- 25.Stadtman ER, Levine RL. Protein oxidation. Ann N Y Acad Sci. 2000;899:191–208. doi: 10.1111/j.1749-6632.2000.tb06187.x. [DOI] [PubMed] [Google Scholar]
- 26.Rubbo H, Radi R, Trujillo M, Telleri R, Kalyanaraman B, Barnes S, Kirk M, Freeman BA. Nitric oxide regulation of superoxide and peroxynitrite-dependent lipid peroxidation. Formation of novel nitrogen-containing oxidized lipid derivatives. J Biol Chem. 1994;269:26066–26075. [PubMed] [Google Scholar]
- 27.Kaur H, Halliwell B. Evidence for nitric oxide-mediated oxidative damage in chronic inflammation. Nitrotyrosine in serum and synovial fluid from rheumatoid patients. FEBS Lett. 1994;350:9–12. doi: 10.1016/0014-5793(94)00722-5. [DOI] [PubMed] [Google Scholar]
- 28.LeDoux SP, Driggers WJ, Hollensworth BS, Wilson GL. Repair of alkylation and oxidative damage in mitochondrial DNA. Mutat Res. 1999;434:149–159. doi: 10.1016/s0921-8777(99)00026-9. [DOI] [PubMed] [Google Scholar]
- 29.Richter C, Park JW, Ames BN. Normal oxidative damage to mitochondrial and nuclear DNA is extensive. Proc Natl Acad Sci U S A. 1988;85:6465–6467. doi: 10.1073/pnas.85.17.6465. [DOI] [PMC free article] [PubMed] [Google Scholar]
- 30.Sly WS, Hu PY. Human carbonic anhydrases and carbonic anhydrase deficiencies. Annu Rev Biochem. 1995;64:375–401. doi: 10.1146/annurev.bi.64.070195.002111. [DOI] [PubMed] [Google Scholar]
- 31.Supuran CT. Carbonic anhydrases: novel therapeutic applications for inhibitors and activators. Nat Rev Drug Discov. 2008;7:168–181. doi: 10.1038/nrd2467. [DOI] [PubMed] [Google Scholar]
- 32.Fleming RE, Parkkila S, Parkkila AK, Rajaniemi H, Waheed A, Sly WS. Carbonic anhydrase IV expression in rat and human gastrointestinal tract regional, cellular, and subcellular localization. J Clin Invest. 1995;96:2907–2913. doi: 10.1172/JCI118362. [DOI] [PMC free article] [PubMed] [Google Scholar]
- 33.Kyllonen MS, Parkkila S, Rajaniemi H, Waheed A, Grubb JH, Shah GN, Sly WS, Kaunisto K. Localization of carbonic anhydrase XII to the basolateral membrane of H+-secreting cells of mouse and rat kidney. J Histochem Cytochem. 2003;51:1217–1224. doi: 10.1177/002215540305100912. [DOI] [PubMed] [Google Scholar]
- 34.Lehtonen J, Shen B, Vihinen M, Casini A, Scozzafava A, Supuran CT, Parkkila AK, Saarnio J, Kivela AJ, Waheed A, Sly WS, Parkkila S. Characterization of CA XIII, a novel member of the carbonic anhydrase isozyme family. J Biol Chem. 2004;279:2719–2727. doi: 10.1074/jbc.M308984200. [DOI] [PubMed] [Google Scholar]
- 35.Pastorekova S, Parkkila S, Parkkila AK, Opavsky R, Zelnik V, Saarnio J, Pastorek J. Carbonic anhydrase IX, MN/CA IX: analysis of stomach complementary DNA sequence and expression in human and rat alimentary tracts. Gastroenterology. 1997;112:398–408. doi: 10.1053/gast.1997.v112.pm9024293. [DOI] [PubMed] [Google Scholar]
- 36.Parkkila S, Parkkila AK, Rajaniemi H, Shah GN, Grubb JH, Waheed A, Sly WS. Expression of membrane-associated carbonic anhydrase XIV on neurons and axons in mouse and human brain. Proc Natl Acad Sci U S A. 2001;98:1918–1923. doi: 10.1073/pnas.98.4.1918. [DOI] [PMC free article] [PubMed] [Google Scholar]
- 37.Leniger T, Thone J, Wiemann M. Topiramate modulates pH of hippocampal CA3 neurons by combined effects on carbonic anhydrase and Cl-/ Br J Pharmacol. 2004;142:831–842. doi: 10.1038/sj.bjp.0705850. [DOI] [PMC free article] [PubMed] [Google Scholar]
- 38.Rosenfeld WE, Doose DR, Walker SA, Nayak RK. Effect of topiramate on the pharmacokinetics of an oral contraceptive containing norethindrone and ethinyl estradiol in patients with epilepsy. Epilepsia. 1997;38:317–323. doi: 10.1111/j.1528-1157.1997.tb01123.x. [DOI] [PubMed] [Google Scholar]
- 39.Deutsch SI, Schwartz BL, Rosse RB, Mastropaolo J, Marvel CL, Drapalski AL. Adjuvant topiramate administration: a pharmacologic strategy for addressing NMDA receptor hypofunction in schizophrenia. Clin Neuropharmacol. 2003;26:199–206. doi: 10.1097/00002826-200307000-00010. [DOI] [PubMed] [Google Scholar]
- 40.Kramer CK, Leitao CB, Pinto LC, Canani LH, Azevedo MJ, Gross JL. Efficacy and safety of topiramate on weight loss: a meta-analysis of randomized controlled trials. Obes Rev. 2011;12:e338–e347. doi: 10.1111/j.1467-789X.2010.00846.x. [DOI] [PubMed] [Google Scholar]
- 41.Verrotti A, Scaparrotta A, Agostinelli S, Di PS, Chiarelli F, Grosso S. Topiramate-induced weight loss: a review. Epilepsy Res. 2011;95:189–199. doi: 10.1016/j.eplepsyres.2011.05.014. [DOI] [PubMed] [Google Scholar]
- 42.Giacco F, Brownlee M. Oxidative stress and diabetic complications. Circ Res. 2010;107:1058–1070. doi: 10.1161/CIRCRESAHA.110.223545. [DOI] [PMC free article] [PubMed] [Google Scholar]
- 43.Kowluru RA, Abbas SN. Diabetes-induced mitochondrial dysfunction in the retina. Invest Ophthalmol Vis Sci. 2003;44:5327–5334. doi: 10.1167/iovs.03-0353. [DOI] [PubMed] [Google Scholar]
- 44.Miller AG, Smith DG, Bhat M, Nagaraj RH. Glyoxalase I is critical for human retinal capillary pericyte survival under hyperglycemic conditions. J Biol Chem. 2006;281:1864–1871. doi: 10.1074/jbc.M513813200. [DOI] [PubMed] [Google Scholar]
- 45.Kang BP, Urbonas A, Baddoo A, Baskin S, Malhotra A, Meggs LG. IGF-1 inhibits the mitochondrial apoptosis program in mesangial cells exposed to high glucose. Am J Physiol Renal Physiol. 2003;285:F1013–F1024. doi: 10.1152/ajprenal.00209.2003. [DOI] [PubMed] [Google Scholar]
- 46.Nakamura T, Ushiyama C, Suzuki S, Hara M, Shimada N, Ebihara I, Koide H. Urinary excretion of podocytes in patients with diabetic nephropathy. Nephrol Dial Transplant. 2000;15:1379–1383. doi: 10.1093/ndt/15.9.1379. [DOI] [PubMed] [Google Scholar]
- 47.Steffes MW, Schmidt D, McCrery R, Basgen JM. Glomerular cell number in normal subjects and in type 1 diabetic patients. Kidney Int. 2001;59:2104–2113. doi: 10.1046/j.1523-1755.2001.00725.x. [DOI] [PubMed] [Google Scholar]


