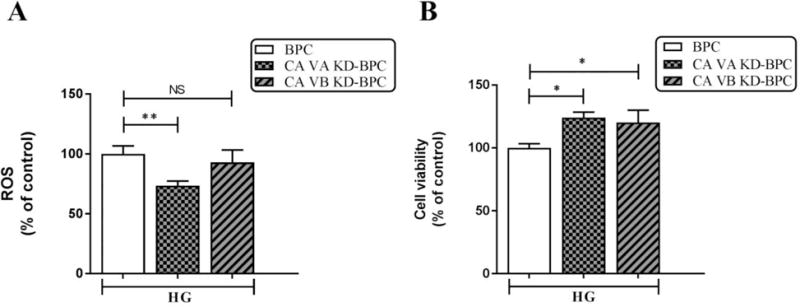
Figure 3. Effect of mitochondrial CA VA and CA VB knockdown on high glucose-induced intracellular ROS in pericytes.

A) ROS. B) Cell viability. Results are presented as percentage of BPC treated with HG. Data are shown as mean ± SEM (n=4–8). The graphs are representative of three independent experiments. *p<0.05, **p<0.01. BPC, brain pericytes; CA VA KD-BPC, CA VA knockdown brain pericytes; CA VB KD-BPC, CA VB knockdown brain pericytes; HG, high glucose; NS, not significant.
