Fig. 4.

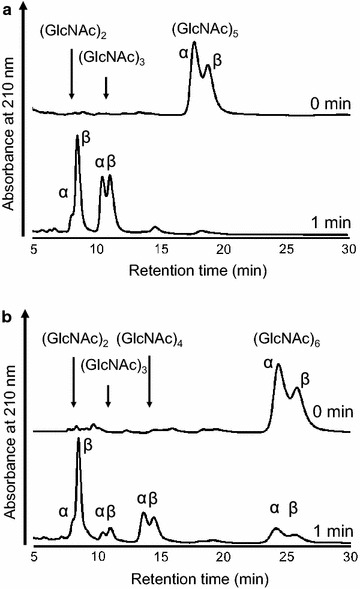
Anomeric analysis of hydrolytic products from (GlcNAc)5 (a) and (GlcNAc)6 (b). Arrows indicate the eluted positions of GlcNAcn (n = 2–4), and peaks are assigned to the α- and β-anomers

Anomeric analysis of hydrolytic products from (GlcNAc)5 (a) and (GlcNAc)6 (b). Arrows indicate the eluted positions of GlcNAcn (n = 2–4), and peaks are assigned to the α- and β-anomers