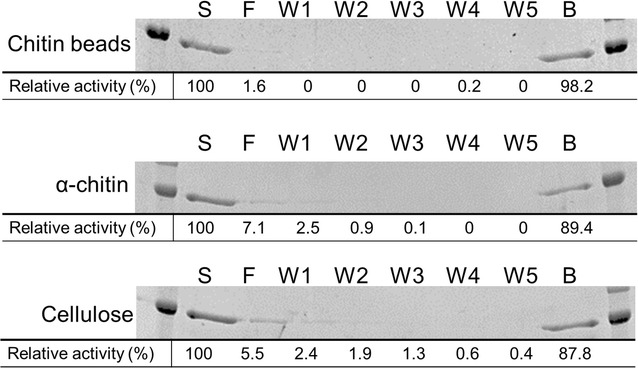
Fig. 5.

Binding activity of BthChi74 to chitin beads, α-chitin, and cellulose. S, F, W and B denote the starting sample, flow-through fraction, wash fraction and binding fraction, respectively. The values represent the relative activity recovered in each fraction with the initial activity in the starting sample taken as 100%. Experiments were carried out in duplicate, and the average values are indicated
