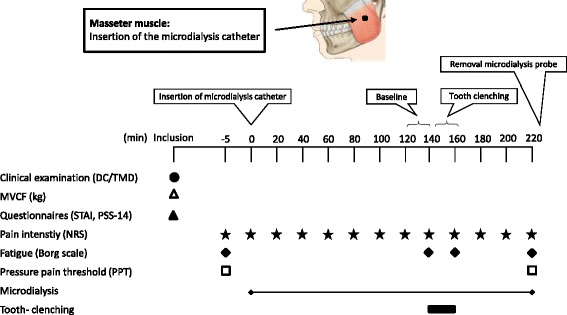
Fig. 1.

Flow chart of the experimental setting. The figure shows the time points (minutes) for the clinical examination (DC/TMD), assessment of MVCF (kg), questionnaires (STAI and PSS-14), pain intensity (NRS), fatigue (Borg scale), pressure pain threshold (PPT), microdialysis sampling and tooth-clenching in 20 women with temporomandibular disorder myalgia (Patients) and 20 pain-free healthy aged-matched women (Controls). DC/TMD = Diagnostic criteria for TMD; STAI = State-Trait Anxiety Inventory; PSS = Perceived Stress Scale
