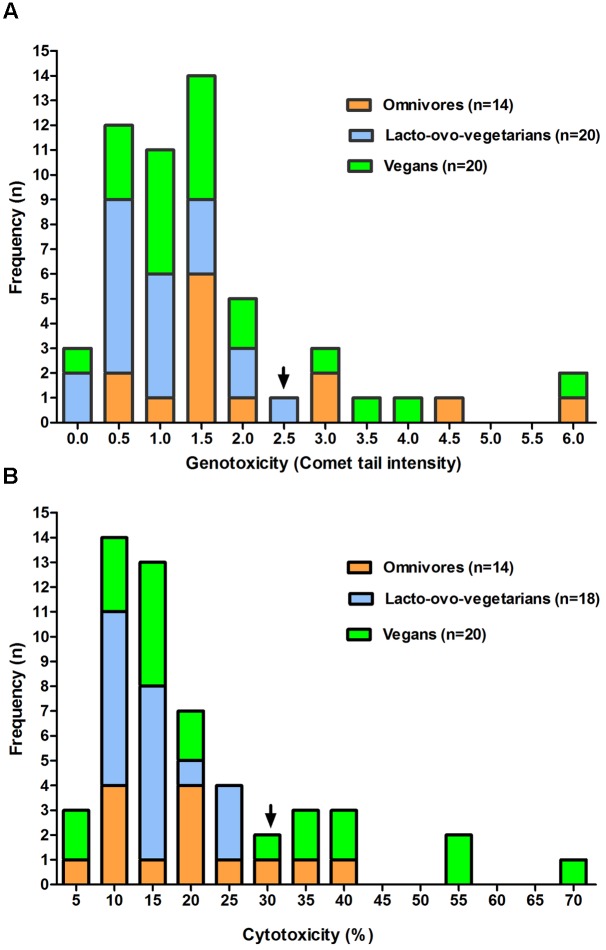
FIGURE 1.
Frequency distribution of genotoxicity (A) and cytotoxicity (B) levels observed for fecal water samples from omnivores, lacto-ovo-vegetarians, and vegans. Only data relative to subjects showing no significant change in the samples of the 2 weeks are included. For each box the arrow indicates an approximation to normality in the first part of the figure.

