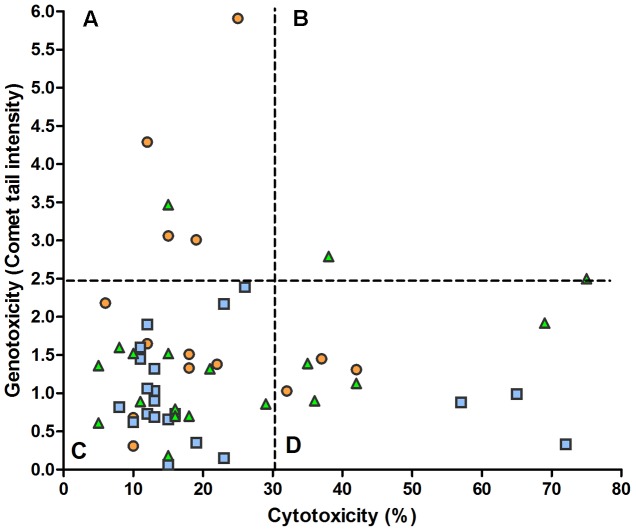
FIGURE 4.
Relation between fecal water cytotoxicity and genotoxicity. The overall analysis of 52 samples from omnivores ( ), lacto-ovo-vegetarians (
 ), and vegans (
 ) showed no significant regression (y = 1.34 + 0.003x) and correlation (r = 0.049). The dashed lines delimit the reference levels for the normality approximation (see Figure 1). (A) low cytotoxicity, high genotoxicity; (B) high cytotoxicity and genotoxicity; (C) low cytotoxicity and genotoxicity; (D) high cytotoxicity, low genotoxicity.

