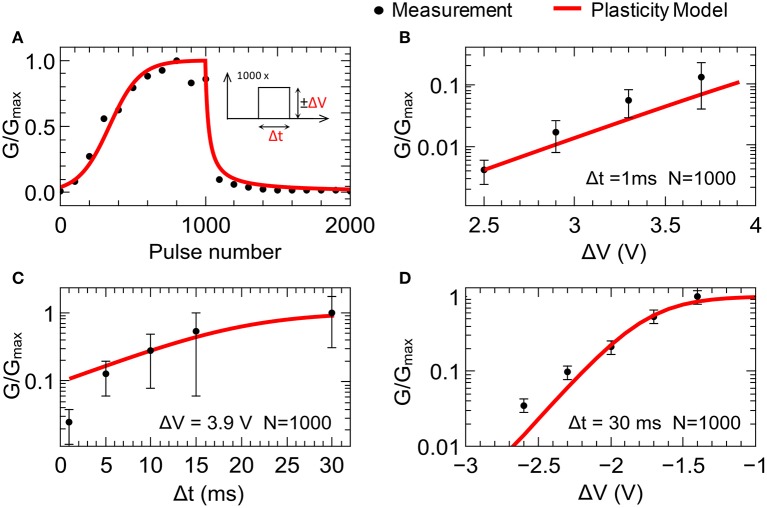
Figure 3.
Synaptic plasticity emulation: (A) Typical plasticity measurement for 1000 potentiation pulses of +3.9 V and 1000 depression pulses of −2.5 V with pulse lengths of 1 ms. Each point represents the conductance after 100 pulses. In (B–D), the change in device conductance after 1000 set (reset) voltage pulses with varying pulse amplitudes (B,C) and lengths Δt (D) is shown. Black dots reflect experimental data measured at 0.48 V. Red lines correspond to the data obtained using the plasticity model (model parameters are summarized in Table 1). The error bars reflect the device variability obtained from 86 individual devices. Gmax is the averaged conductance of 86 devices after 1000 voltage pulses of 3.9 V in amplitude and 1 ms in length.

