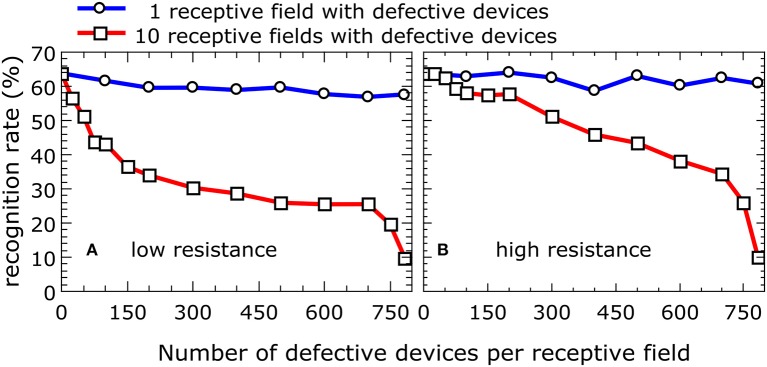
Figure 7.
Impact on the recognition rate of defective devices: Recognition rate as function of the number of defective devices with low and high resistance per receptive field. The blue curve represents the situation where only one of the 10 receptive fields contains defective devices, while the red curve was obtained from a simulation where all 10 receptive fields contain defective devices. The full set of 60,000 MNIST training images was applied three times to a network with 10 output neurons for the simulation. The presented data were averaged over three total simulation runs. (A) Low resistance. (B) High resistance.

