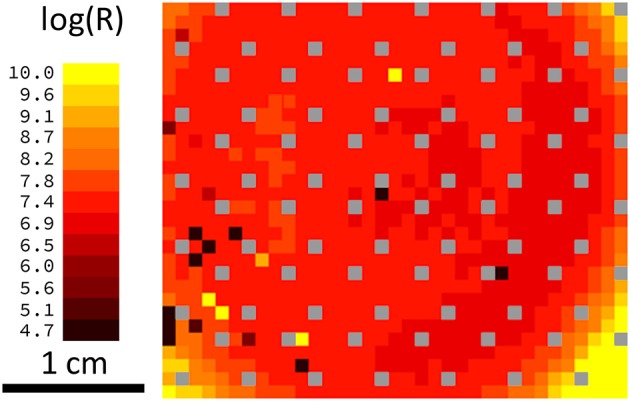
Figure 8.

Resistance distribution and yield: Wafermap showing the resistance of the memristive devices in the center of the wafer. Each square represents one device with the color-coded resistance. Black squares are shorted devices; individual yellow squares are problems during the final metallization and gray squares contain no memristive devices (space used for testing structures). Yellow squares in the corners stem from different sputtering conditions at the border of the wafer. Considering the defective devices, the yield in the center of the wafer is ~98%.
