
FIGURE 1.
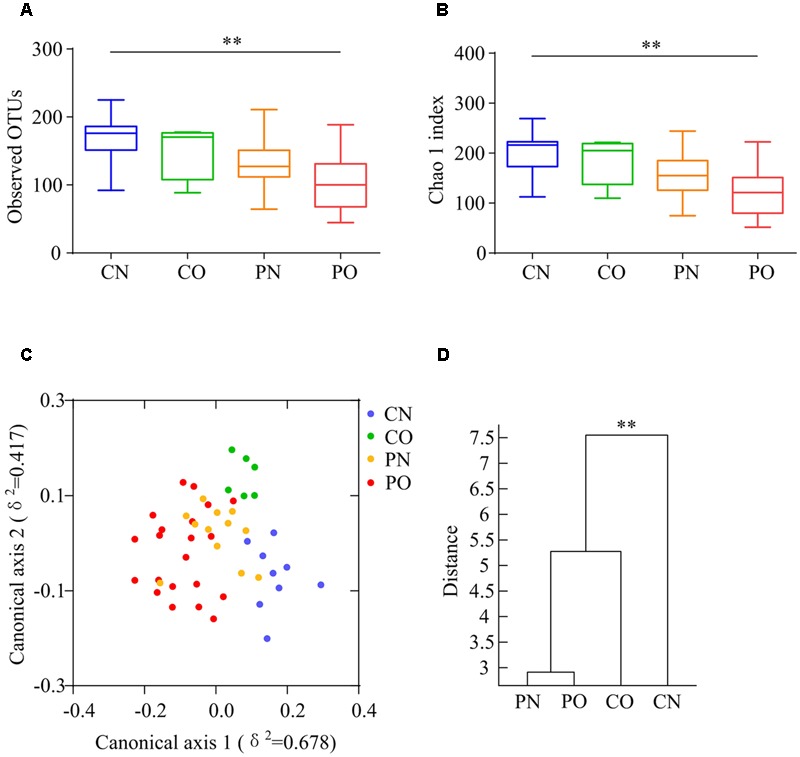
Overall structural differentiation of gut microbiota based on UniFrac distance between four groups. (A) OTU-level rarefaction (observed OTUs). (B) Chao 1 index. Values are shown by box-plot. Box represents the interquartile range. The line inside the box represents the median. And whiskers denote the minimum and maximum value. ∗∗Adjusted P < 0.01 (Kruskal–Wallis test). (C) Bray–Curtis CAP using the first 13 PCs (accounting for 80.67% of the total variation). (D) Clustering of gut microbiota based on Bray–Curtis distance calculated with MANOVA using the first 13 PCs. ∗∗P < 0.01. CN: non-obese control group, n = 9. CO: obese control group, n = 6. PN: non-obese PCOS group, n = 12. PO: obese PCOS group, n = 21.