
FIGURE 3.
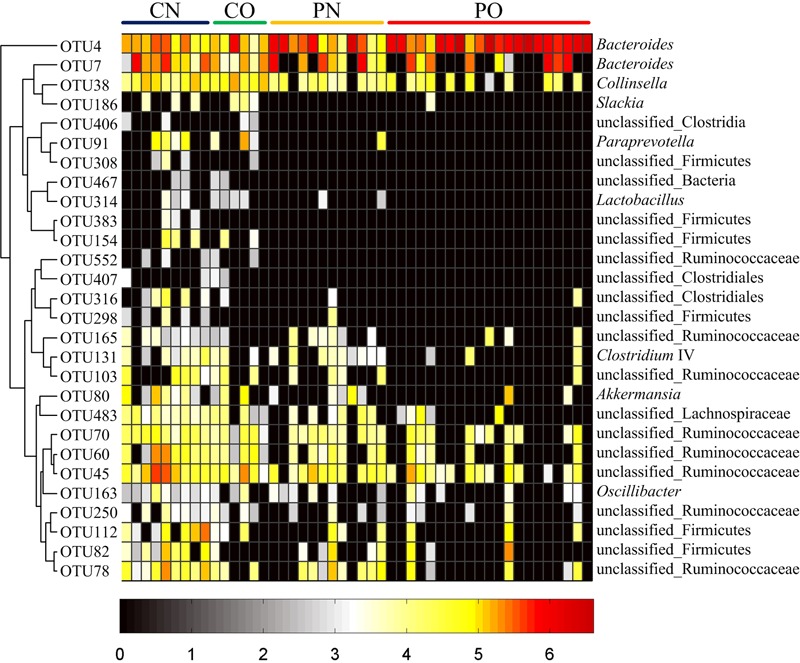
Heat map of the relative abundances of 28 key OTUs related to the alteration of gut microbiota between the four groups. The color of the spots represents the relative abundance (normalized and log-transformed) of the OTUs. OTUs are ordered by spearman correlation analysis based on relative abundance. The genus-level taxonomic assignment is shown on the right. For CN, n = 9; for PN, n = 12; for CO, n = 6; and for PO, n = 21.