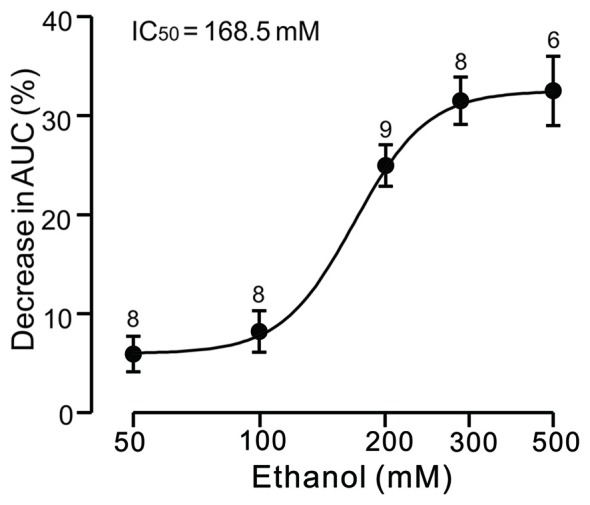
Figure 3.

Concentration-response curve showing the ethanol-induced decrease in the AUC of CS-induced inward currents in cerebellar PCs. The IC50 value obtained from the curve is 168.5 mM. The number of recorded PCs tested for each concentration is indicated near the bars. Error bars indicate S.E.M.
