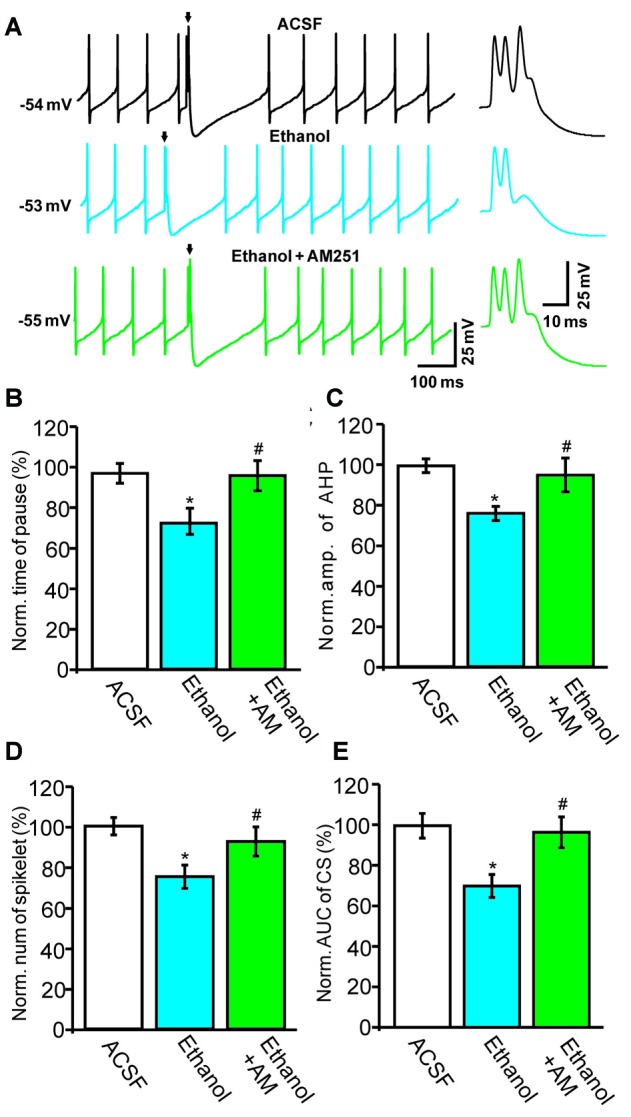
Figure 5.

Blockade of the cannabinoid receptor 1 (CB1) abolishes ethanol-induced inhibition of spontaneous CS activity. (A) Representative traces showing the spontaneous activities of a PC in treatments of ACSF, ethanol (300 mM) and ethanol + AM251 (5 μM). Arrows denote CSs. (B) Pooled data showing the pause in SSs in treatments of ACSF, ethanol and ethanol + AM251. (C) Summary of data showing the normalized amplitude of the AHP in treatments of ACSF, ethanol and ethanol + AM251. (D,E) Bar graphs showing the effect of ethanol on the normalized spikelet number (D) and AUC (E) of CSs in treatments of ACSF, ethanol and ethanol + AM251. Arrows indicate spontaneous CSs. n = 6 cells per group. *P < 0.05, vs. ACSF; #P < 0.05, vs. ethanol.
