Figure 1.
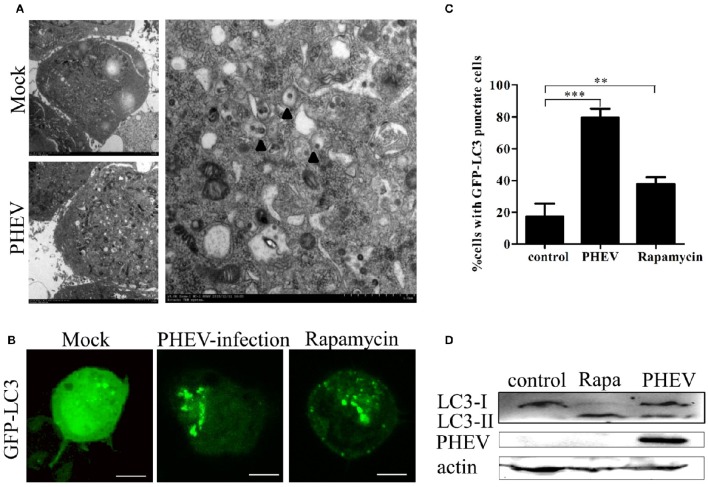
Autophagosomes accumulate in PHEV-infected Neuro-2a cells. (A) TEM observations. Neuro-2a cells were mock infected or infected with PHEV for 24 h and studied by transmission electron microscopy. Black triangles indicate the structures with autophagosomes characteristics. (B) Confocal microscopy. Neuro-2a cells were transfected with GFP-LC3 followed by treatment at 24 h post transfection with mock treatment as a negative control, and rapamycin treatment as a positive control. The localization of GFP-LC3 positive autophagosome accumulation (green) and the S-tagged PHEV products (red) was visualized using a confocal microscope. (C) The quantification of cells showing GFP-LC3 puncta in PHEV-infected cells. In three random fields, the average number of puncta in each cell was taken from at least 80 cells in each treatment. Representative results with graphs are shown in Figure 1B. (D) Western blotting. The turnovers of LC3-I to LC3-II were detected for mock-treated Neuro-2a cells, rapamycin-treated Neuro-2a cells, and PHEV-infected Neuro-2a cells. Cells were collected at appropriate time points and detected with anti-LC3B antibody, and β-actin was used as a protein loading control. **P < 0.01; ***P < 0.001. Scale bars: 10 μm.

