
FIGURE 1.
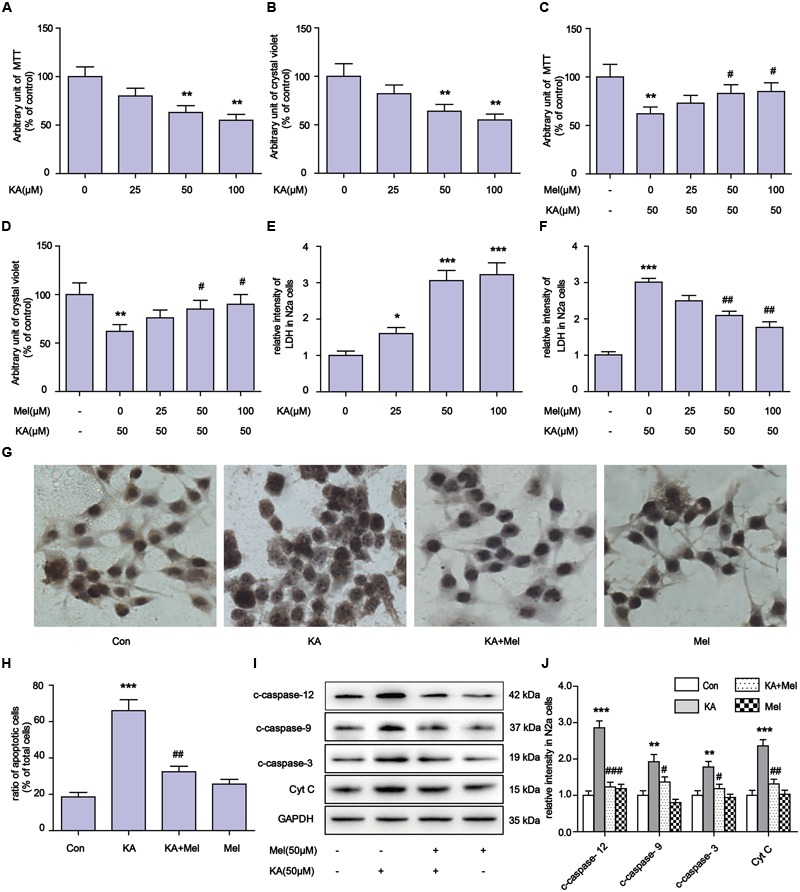
Melatonin mitigates kainic acid (KA)-induced N2a cells apoptosis. (A) N2a cells viability were assayed by MTT after treatment with 0, 25, 50, 100 μM KA. (B) N2a cells viability were assayed by crystal violet after treatment with 0, 25, 50, 100 μM KA. (C) N2a cells viability were assayed by MTT after treatment with both melatonin and KA. (D) N2a cells viability were assayed by crystal violet after treatment with both melatonin and KA. (E) LDH release after treatment with 0, 25, 50, 100 μM KA. (F) LDH release after treatment with both melatonin and KA. (G,H) N2a cells apoptosis was assayed by tunnel staining. (I) The levels of c-caspase-12, -9, -3 and Cyt C in N2a cells. (J) Expression analysis of c-caspase-12, -9, -3 and Cyt C (∗P < 0.05, ∗∗P < 0.01, ∗∗∗P < 0.001 vs. controls; #P < 0.05, ##P < 0.01, ###P < 0.001 vs. the KA group; significant difference from the respective values determined by one-way analysis of variance test. n = 3 for western blots and tunnel assay).