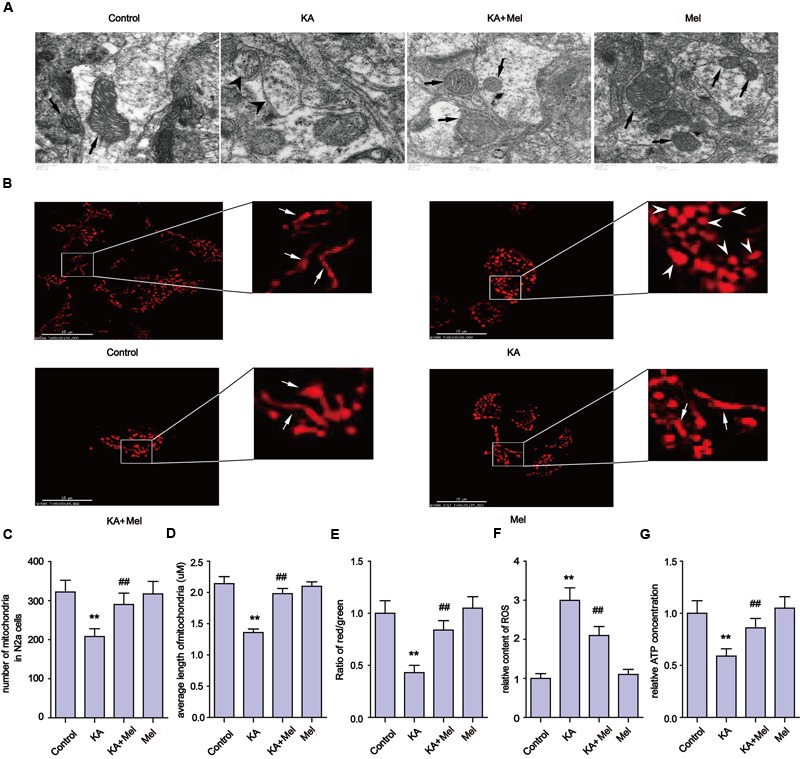
FIGURE 3.

Melatonin ameliorates KA-induced mitochondrial fragmentation and dysfunction. (A) Transmission electron microscope images of mitochondrial ultrastructure in KA and/or melatonin-treated N2a cells. (B) The morphology of mitochondria stained by mito-tracker in KA and/or melatonin-treated N2a cells. (C) Numbers of mitochondria in KA and/or melatonin-treated N2a cells. (D) Average length of mitochondria in KA and/or melatonin-treated N2a cells. (E) Mitochondrial membrane potential (MMP) in KA and/or melatonin-treated N2a cells. (F) ROS production in KA and/or melatonin-treated N2a cells. (G) ATP concentration in KA and/or melatonin-treated N2a cells (∗∗P < 0.01 vs. controls; ##P < 0.01 vs. the KA group; significant difference from the respective values determined by one-way analysis of variance test. n = 3).
