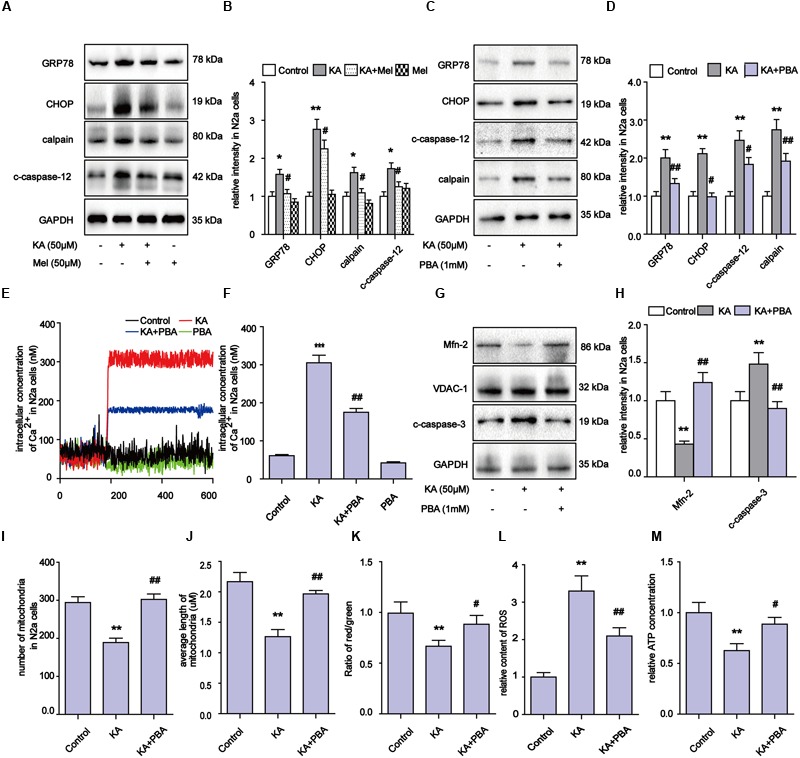
FIGURE 7.

Kainic acid-induced ER stress contributes to mitochondrial defects and apoptosis and melatonin can effectively suppress ER stress. (A,B) Expression levels of GRP78, CHOP, calpain, c-caspase-12 in KA and/or melatonin treated N2a cells. (C,D) Expression levels of GRP78, CHOP, calpain, c-caspase-12 in KA and/or PBA treated N2a cells. (E,F) Fura-2 AM probe was used to measure real-time Ca2+ concentration in KA and/or PBA treated N2a cells. (G,H) Expression levels of Mfn-2 and c-caspase-3 in KA, KA+PBA treated N2a cells. (I) Mitochondria number in KA, KA+PBA treated N2a cells. (J) Average length of mitochondria in KA, KA+PBA treated N2a cells. (K) MMP in KA, KA+PBA treated N2a cells. (L) Relative production of ROS in KA, KA+PBA treated N2a cells. (M) Relative content of ATP in KA, KA+PBA treated N2a cells (∗P < 0.05, ∗∗P < 0.01, ∗∗∗P < 0.001 vs. controls; #P < 0.05, ##P < 0.01 vs. the KA group; significant difference from the respective values determined by one-way analysis of variance test. n = 3).
