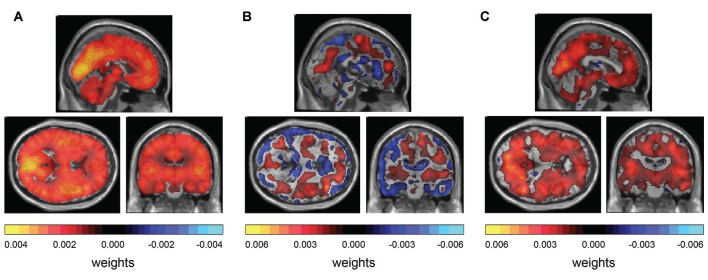
Figure 2.
Weight maps for classification. (A) GPC between controls and group 1 (EDSS 0) shows diffuse distribution of positive weights. (B) GPC between controls and group 2 (EDSS 1–2) shows diffuse distribution of positive weights and negative weights. (C) GPC between controls and group 3 (EDSS 2.5–10) shows diffuse distribution of positive weights and negative weights.

