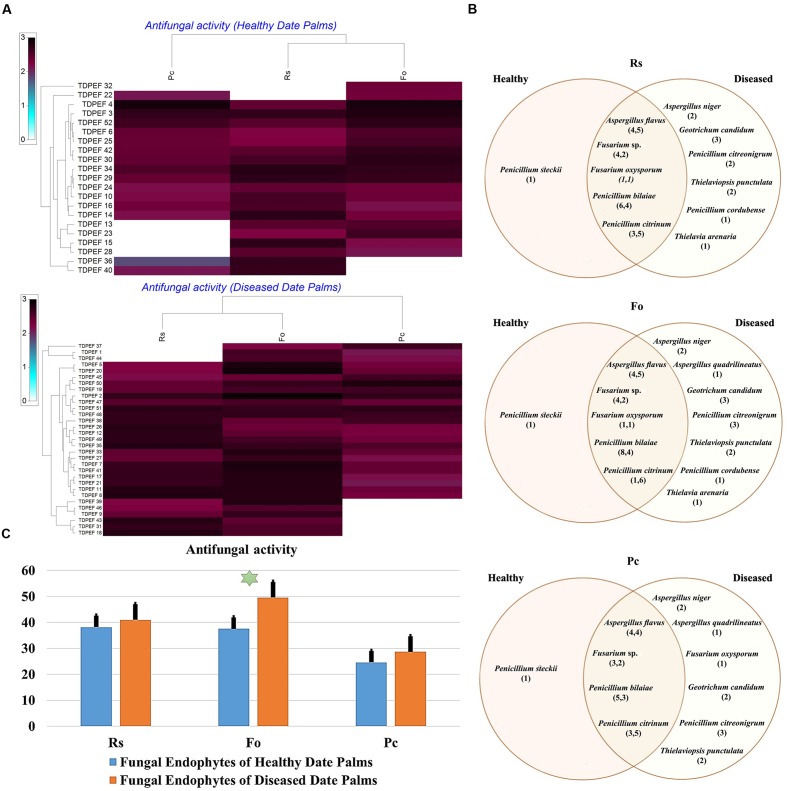
FIGURE 5.
(A) Heat map of antifungal (fungal isolates including Rs. Fo, and Pc) activity against fungal endophytes isolates from healthy and BLD date palm roots. (B) Venn diagram showing the distribution of endophytic fungal isolates in relation to different fungal isolates (the first number between brackets represents the number of isolates recovered from healthy roots and the second number represents that recovered from BLD roots). (C) Antifungal activity against fungal endophytes isolates from healthy and BLD date palm roots. Data presents mean ± standard error. Bars labeled with asterisk are significantly different among the treatments at P < 0.05 using ANOVA analysis.

