
FIGURE 3.
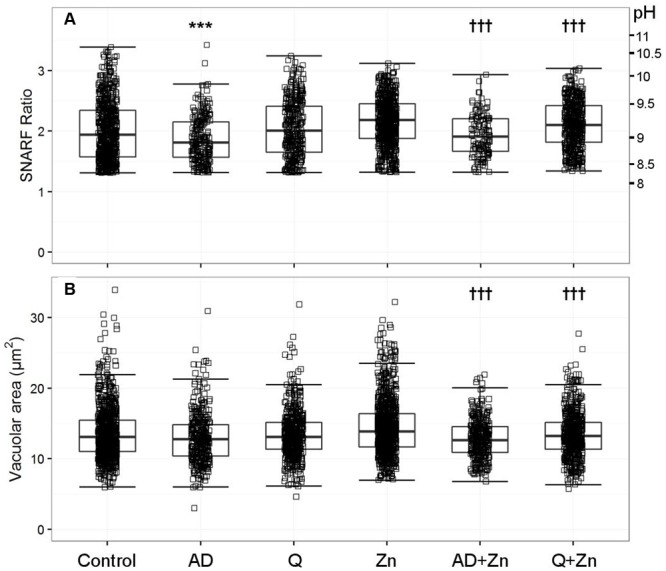
The effect of anandamide and quinidine with and without Zn2+ on vacuolar pH (A) and area (B). The acidic vacuoles excluded are those with a SFR below 1.31. Each square represents an individual measurement; each condition has an overlaying boxplot showing the median and interquartile range. More detailed statistics are provided in Table 2. A (anandamide 100 μM), Q (quinidine 100 μM), Zn (Zn2+ 100 μM). Differences from control neutrophils: ∗p < 0.05, ∗∗p < 0.01, ∗∗∗p < 0.001. Differences from neutrophils incubated with Zn2+: †p < 0.05, ††p < 0.01, †††p < 0.001.