
FIGURE 9.
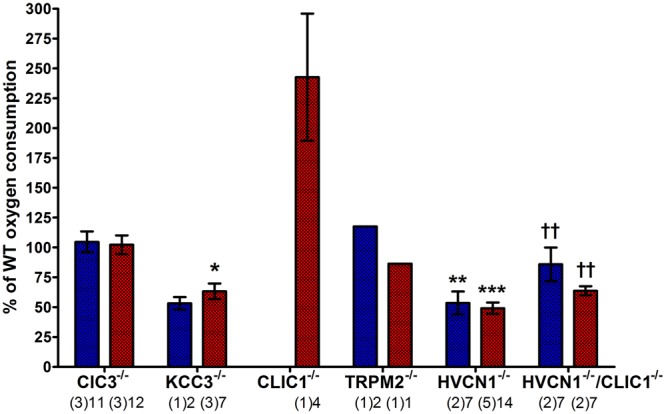
Measuring oxygen consumption in ClC3, KCC3, CLIC1, TRPM2, and HVCN1 deficient mouse peritoneal neutrophils induced by PMA (blue) and opsonized Candida (red). Oxygen consumption (OC) is presented as a relative percentage of the wild-type control (mean ± SEM). The numbers below indicate the number of separate experiments in brackets and number of wells recorded. Differences from WT neutrophils within each experiment: ∗p < 0.05, ∗∗p < 0.01, ∗∗∗p < 0.001. The statistics for HVCN1-/-/CLIC1-/- neutrophils are compared to HVCN1-/- controls where ††p < 0.01.