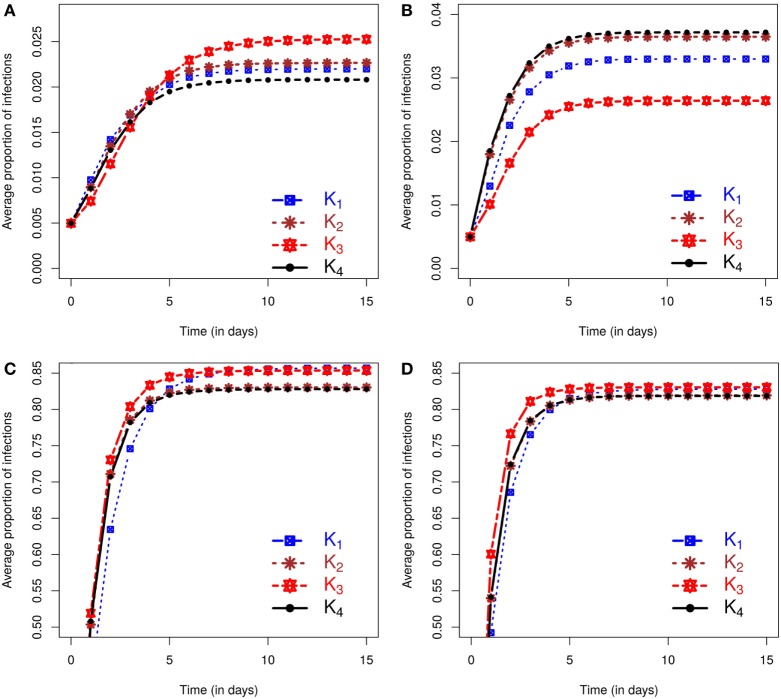
Figure 1.
Posterior predicted average proportion of premises infected as the epidemics evolve in time (days). On each graph, the lines correspond to the results obtained when kernels K1 − K4 are fitted to data. The column on the left shows results using data from simulation study 1a and is divided into predicted outbreaks that are (A) small or (C) large. The column on the right shows results from simulation study 1b, stratified for (B) small or (D) large predicted outbreaks. The size of outbreaks was classified as either small or large based on final outbreak sizes being smaller or larger than the mean of the final size distribution (see text for details).

