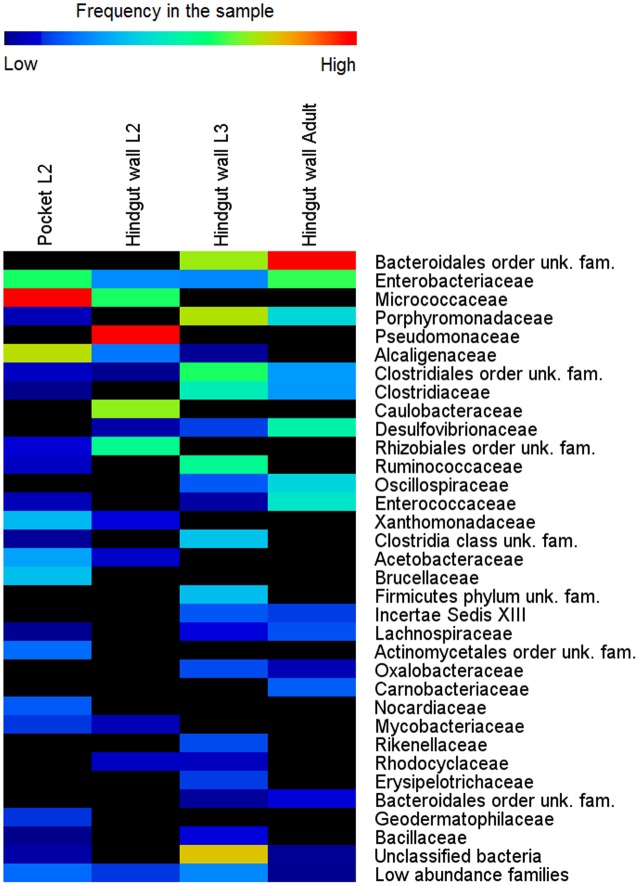
FIGURE 3.
Bacterial community composition in different life stages of M. hippocastani. Relative abundance of bacterial taxa, in percentage of total sample sequences, from 454 pyrosequencing data (110,772 sequences in total) is displayed as a heat map based on the log-transformed values. Warm colors indicate higher and cold colors lower abundances. Families with total relative abundance lower than 0.4% were considered “low abundance families” and listed in Supplementary Table S3. unk., unknown; fam., family.

