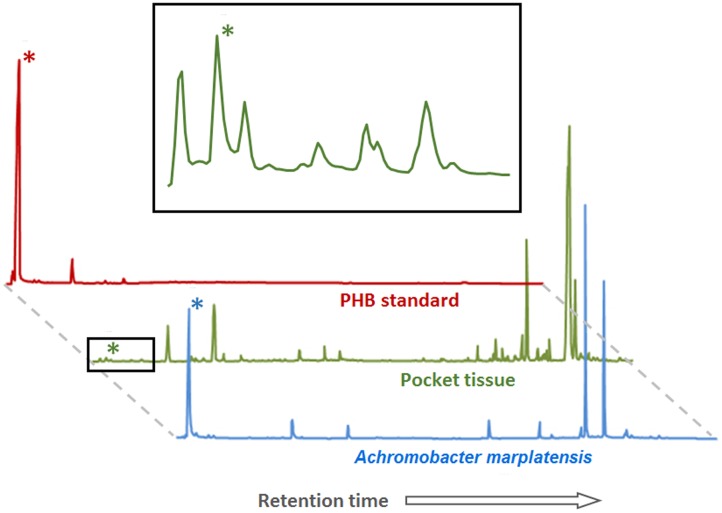
FIGURE 5.
Poly-β-hydroxybutyrate (PHB) detection by GC-MS in pocket tissue and Achromobacter marplatensis isolated from the pocket. The peak height reflects the relative abundance of the substance. Peaks marked with (∗) correspond to the methyl ester of the 3-hydroxybutyric acid monomer of PHB. The area marked with a black square is enlarged above. The other peaks correspond to a variety of fatty acids of different chain lengths, common in both eukaryotic and prokaryotic cells, and to artifacts created by the method (peaks in the PHB standard chromatogram).

