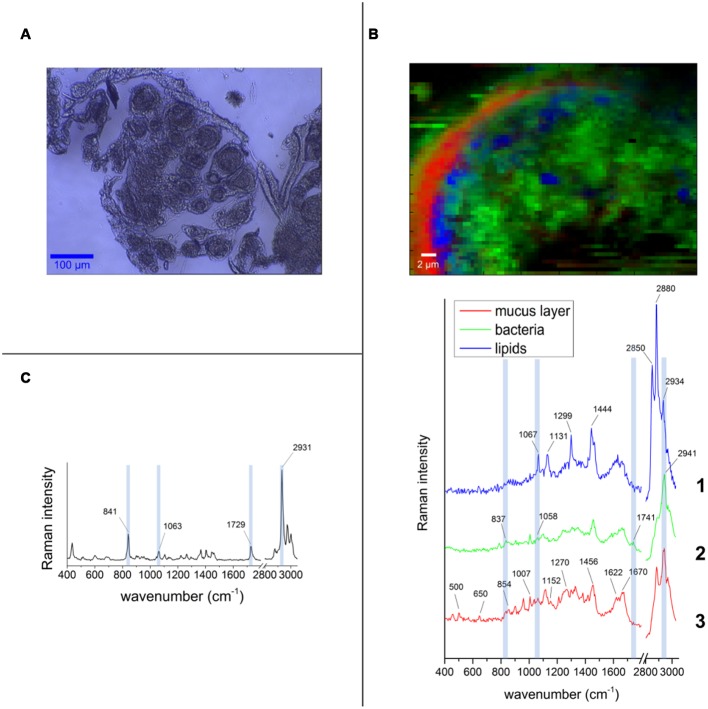
FIGURE 6.
False-color Raman images and spectra obtained from the pocket tissue with 532 nm excitation wavelength. (A) Bright field image of one of the tissue cuts used for the measurements. The round shape of the pocket poles is clearly visible. (B) Pocket pole with PHB-containing bacteria (green area in false-color image, spectrum 2). Spectrum 1 corresponds to fatty acids (blue area in false-color image) and spectrum 3 corresponds to the acellular mucus-like layer that surrounds the inner part of the pole epithelium (red area in false-color image). (C) Spectrum of the PHB pure substance is used as standard compound. The bands that are distinguishable in the spectrum from the pocket pole are highlighted in light blue.

