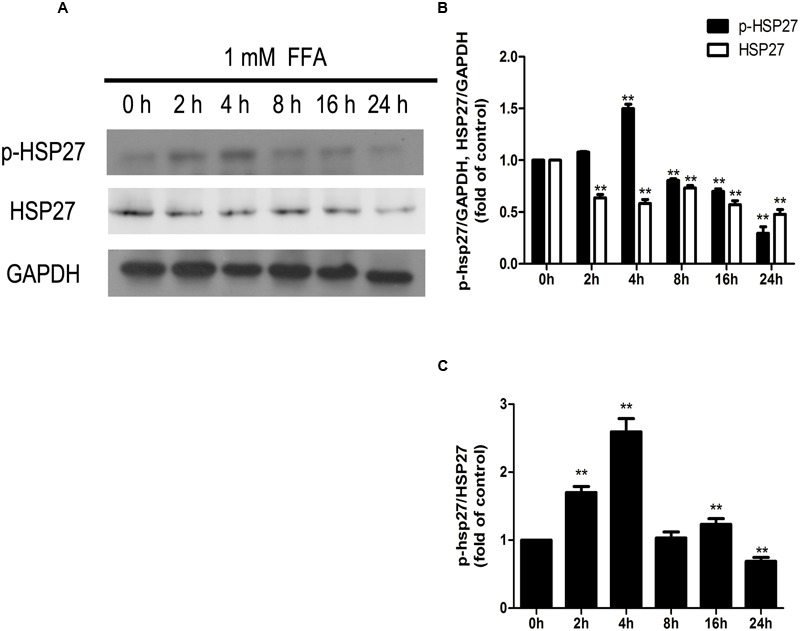
FIGURE 8.

Dynamic changes in the amounts of phosphorylated HSP27 and total HSP27 (A,B), and phosphorylation level of HSP27 (A,C) during the process of FFA treatment. GAPDH was used as a loading control. Values are expressed as mean ± SD in each group. ∗∗p < 0.01 vs. 0 h group.
