
Figure 3.
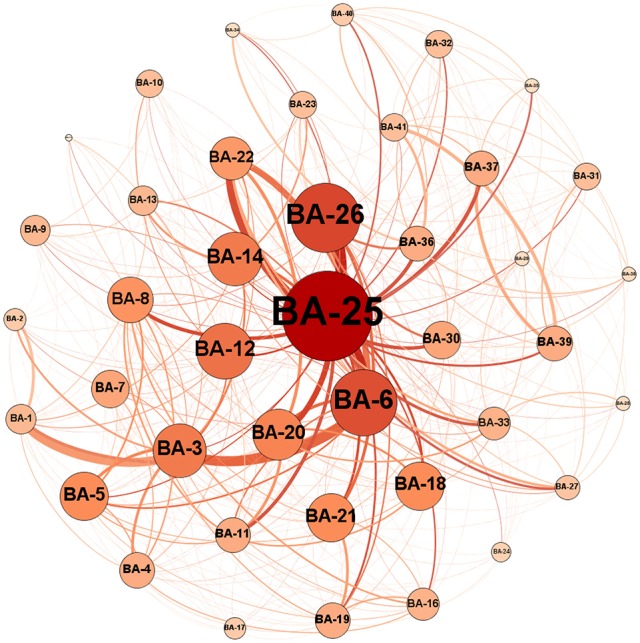
An example of a graph for an MCI patient where each circle represents one node, i.e., a Brodmann area (BA) in the brain, and connections between nodes represent edges, i.e., white matter connections. The numbers on the nodes represent the label of the Brodmann areas. The diameter of each node is proportional to the number of connections of its corresponding Brodmann areas, and the thickness of each line represents the weight or connection strength of the edge.