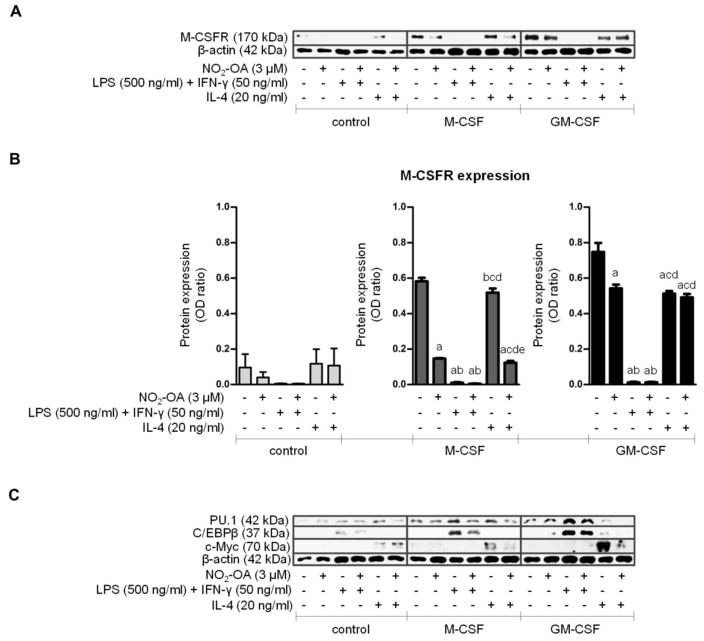
Figure 3. The effect of NO2-OA on M-CSFR, PU.1, C/EBPβ, and c-Myc expression in CSF-induced BMMs differentiated for 7 days.
Native BMCs were isolated and cultivated with M-CSF (20 ng/ml) or GM-CSF (20 ng/ml) and NO2-OA (3 μM) in DMEM for 7 days. Adherent BMMs were then activated with LPS (500 ng/ml) and IFN-γ (50 ng/ml) or with IL-4 (20 ng/ml) for 24 h. For schematic representation of BMC experimental setup see Figure 1A. (A) Expression of M-CSFR and β-actin in adherent BMMs; Western blot pictures represent one of three individual experiments. (B) Assessment of M-CSFR expression in adherent BMMs; n=3. A p value of less than 0.05 was considered significant and statistical comparison is presented as follows: a, b, c, d, and e represents the group of data statistically significant when compared to the data in the first (a), second (b), third (c), fourth (d), and fifth (e) bar, respectively. (C) Expression of PU.1, C/EBPβ, c-Myc, and β-actin in adherent BMMs; representative Western blot pictures.

