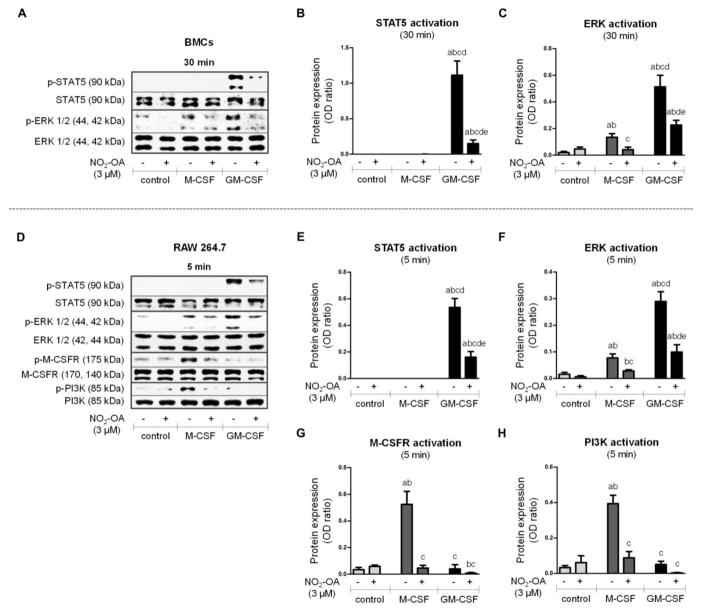
Figure 5. The effect of NO2-OA on STAT5, ERK, M-CSFR, and PI3K activation during early phase of differentiation.
Native BMCs were isolated and treated with M-CSF (20 ng/ml) or GM-CSF (20 ng/ml) and NO2-OA (3 μM) for 30 min (A–C). RAW 264.7 macrophages were treated with M-CSF (50 ng/ml) or GM-CSF (50 ng/ml) and NO2-OA (1 μM) for 5 min (D–H). For schematic representation of experimental setups see Figure 1. (A) Activation of STAT5 (Tyr694) and ERK 1/2 (Thr202/Tyr204) in adherent and nonadherent BMCs; Western blot pictures represent one of four individual experiments. (B, C) Assessment of STAT5 and ERK 1/2 phosphorylation in adherent and nonadherent BMCs; n=4. (D) Activation of STAT5 (Tyr694), ERK 1/2 (Thr202/Tyr204), M-CSFR (Tyr723), and PI3K (Tyr458) in RAW 264.7; Western blot pictures represent one of four individual experiments. (E–H) Assessment of STAT5, ERK 1/2, M-CSFR, and PI3K phosphorylation in RAW 264.7; n=4. A p value of less than 0.05 was considered significant and statistical comparison is presented as follows: a, b, c, d, and e represents the group of data statistically significant when compared to the data in the first (a), second (b), third (c), fourth (d), and fifth (e) bar, respectively.

