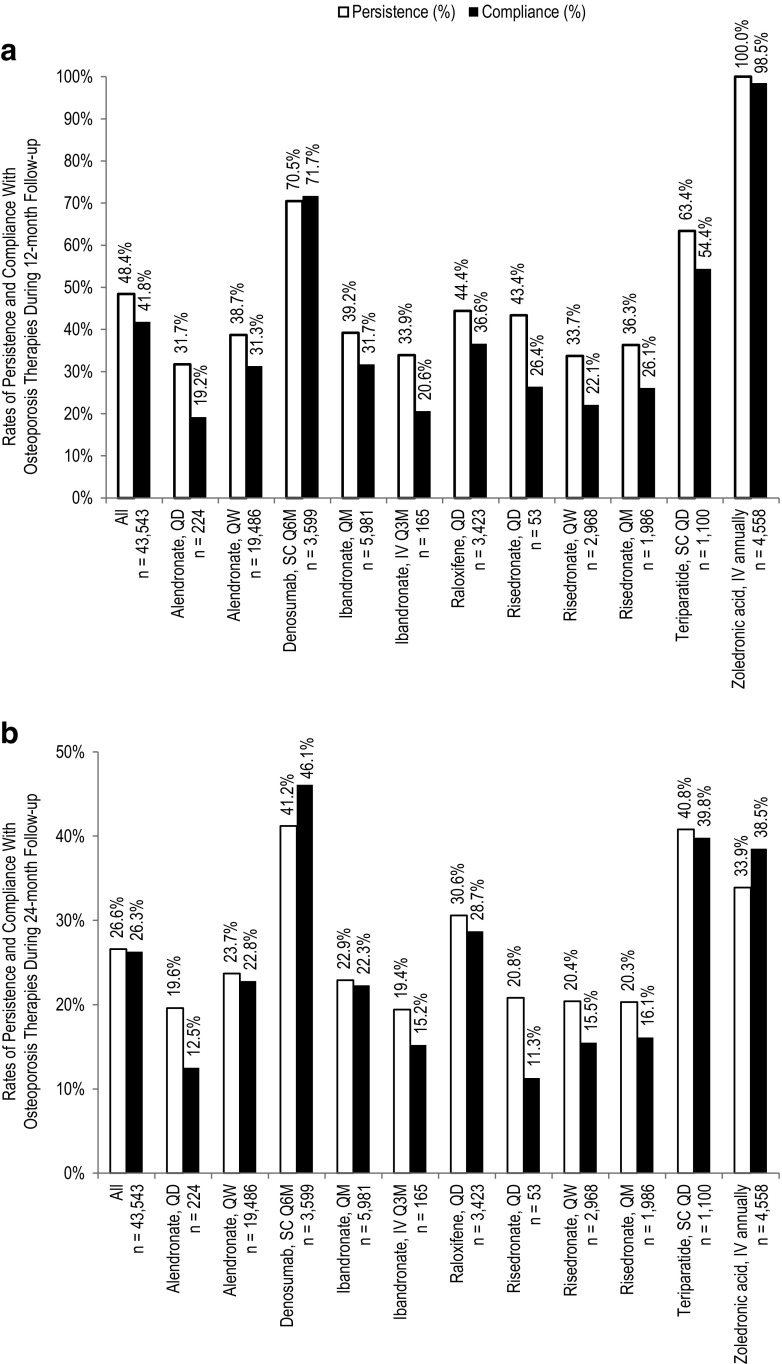
Fig. 2.
Rates of persistence and compliance with osteoporosis therapies during 12- and 24-month follow-up. Rates of persistence (white bars) and compliance (black bars) among women receiving osteoporosis therapies of interest during a 12-month and b 24-month follow-up. IV intravenous, QD once daily, QM once monthly, Q3M once every 3 months, Q6M once every 6 months, QW once a week, SC subcutaneous

