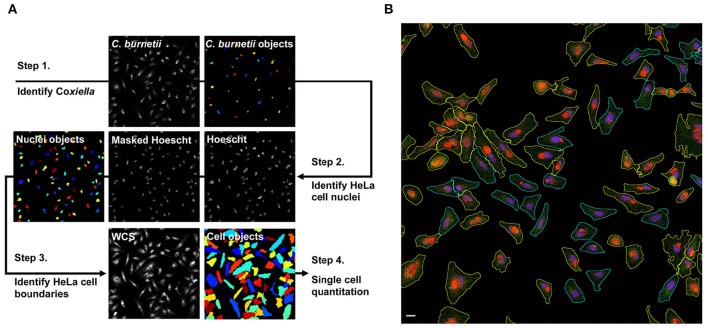
Figure 2.
Summary of CellProfiler image segmentation and analysis pipeline. (A) Hoescht, Tf488, C. burnetii, and whole cell stain (WCS) channels were imported to CellProfiler as gray-scale Tiffs. In step 1, the IdentifyPrimaryObjects module was used to define C. burnetii. In step 2, the Hoescht channel was masked with C. burnetii objects to remove signal from bacterial nucleic acids, then the IdentifyPrimaryObjects module was applied to define host cell nuclei. In step 3, cell boundaries on the WCS channel were defined using the IdentifySecondaryObjects module to propagate from the host cell nuclei identified in step 2. In step 4, CellProfiler modules MeasureObjectIntensity and MeasureObjectShapeSize were used to quantitate multiple size, shape, and intensity parameters for each of the cell objects. (B) Representative fluorescence micrograph depicting segmentation and sorting of infected cells with large PV. Infected HeLa cells loaded with Tf488 (green) were stained with rabbit anti-C. burnetii serum and Alexa Fluor 594 conjugated anti-rabbit secondary antibody (red) and Hoescht (blue). (The green channel intensity was increased for better visibility of Tf488.) CellProfiler was used to sort infected cells (cyan outlines) by C. burnetii intensity per cell and to select those cells with large PV (yellow outlines). Scale bar, 20 μm.

