Figure 3.
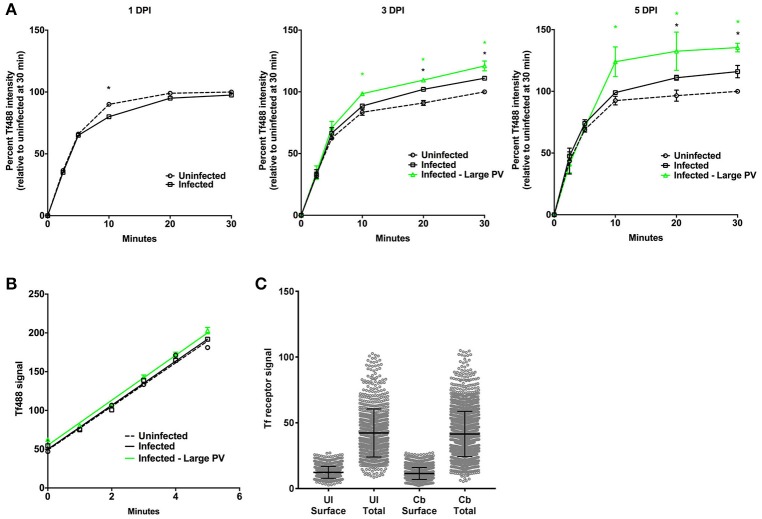
Cells infected with C. burnetii exhibit more internalized Tf. (A) HeLa cells infected with C. burnetii or left uninfected were incubated with Tf488 for the indicated times. CellProfiler was used to select only cells that emitted strong C. burnetii signal (Infected—large PV) from the total population of cells in infected cell cultures (Infected). The amount of intracellular Tf was measured by quantitative fluorescence microscopy. Plots depict percent Tf488 intensity calculated relative to uninfected cell cultures (Uninfected) at 0 min. A black asterisk indicates the mean Tf intensity of infected cell cultures is significantly greater than for uninfected cell cultures. A green asterisk indicates the mean Tf intensities of the subset of cells containing large PV is significantly greater than for infected or uninfected cell cultures. Statistical significance (P < 0.01) was determined by two-way ANOVA using Tukey's test for multiple comparisons with the mean number of cells counted per sample equal to 1038 ± 411. (B) Similar slopes were detected in the linear first 5 min of the Tf endocytosis assay, indicating increased internalized Tf by infected cells is not due to an increase in the rate of uptake (3 days post-infection). The plot depicts mean Tf488 signal intensity (integrated intensity per cell) with the mean number of cells counted at each time point equal to 1553 ± 178. (C) Increased internalized Tf by infected cells (total population) is not associated with increased surface expression of Tf receptor. Uninfected and infected cells (3 days post-infection) were fixed and stained for surface and total cellular Tf receptor. The mean number of cells counted per sample is equal to 2437 ± 582. Results are representative of 3 independent experiments and error bars indicate the standard errors from the means.

