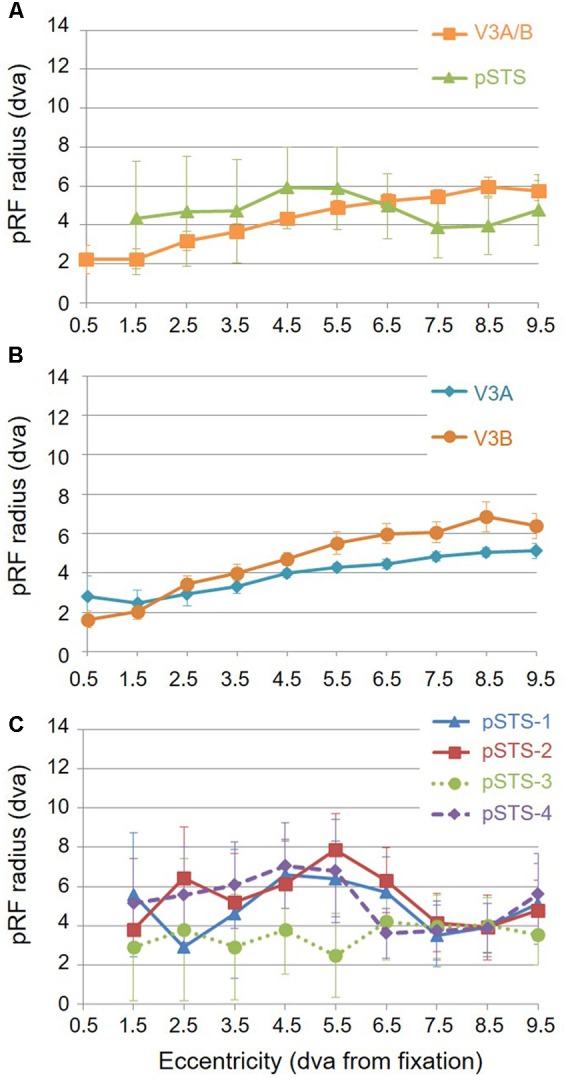
FIGURE 8.

Average pRF sizes. Graphs depict the average pRF radius as a function of 1° eccentricity bins from fixation to 10° for each VFM. Note that there are no pRF centers that fall within the 0.5 eccentricity bin due to the relatively large pRF sizes within the pSTS cluster (Brewer and Barton, 2014, p. 212). (A) pRF sizes for each cloverleaf cluster. Orange squares: V3A/B; Green triangles: pSTS. (B) pRF sizes for V3A and V3B VFMs. Dark orange circles: V3A; Teal diamonds: V3B. (C) pRF sizes for each pSTS VFM. Blue triangles: pSTS-1; Red squares: pSTS-2; Green circles, dotted line: pSTS-3; Purple diamonds, dashed line: pSTS-4. All data are averaged across all 10 hemispheres. dva, degrees of visual angle. Error bars are SEM.
